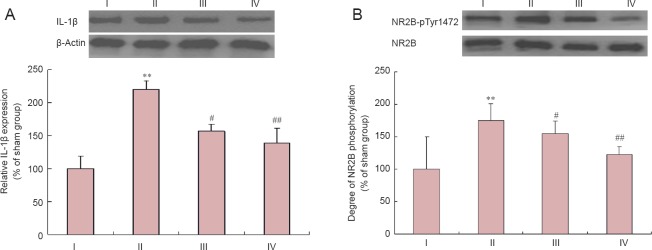
Figure 3.
Relative IL-1β expression (A) and degree of NR2B phosphorylation (B) in the hippocampus (western blot assay).
Data are expressed as the mean ± SD (n = 3 rats per group). The experiment was performed in triplicate. **P < 0.01, vs. sham group; #P < 0.05, ##P < 0.01, vs. 2VO group (one-way analysis of variance and Bonferroni post hoc test). I: Sham; II: 2VO; III: 10 mg/kg Tet; IV: 30 mg/kg Tet. IL-1β: Interleukin-1β; NR2B: N-methyl-D-aspartate receptor 2B; NR2B-pTyr1472: NR2B phosphorylated at tyrosine 1472.

