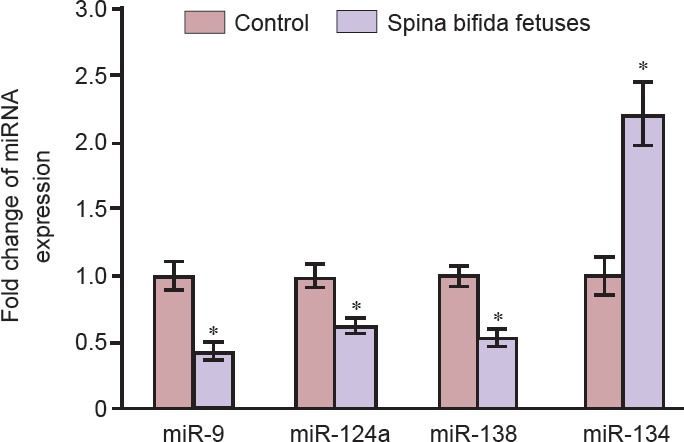
Figure 3.

Expression levels of miRNA-9, miRNA-124a, miRNA-138, and miRNA-134 in the amniotic fluid of rats with fetuses modeling spina bifida and control rats with normal fetuses as determined using real-time quantitative reverse transcription-polymerase chain reaction.
Relative miRNA expression is shown as the mean ± SD (n = 6 rats per group). *P < 0.05, vs. control fetuses (two-sided Student's t-test).
