Figure 4.

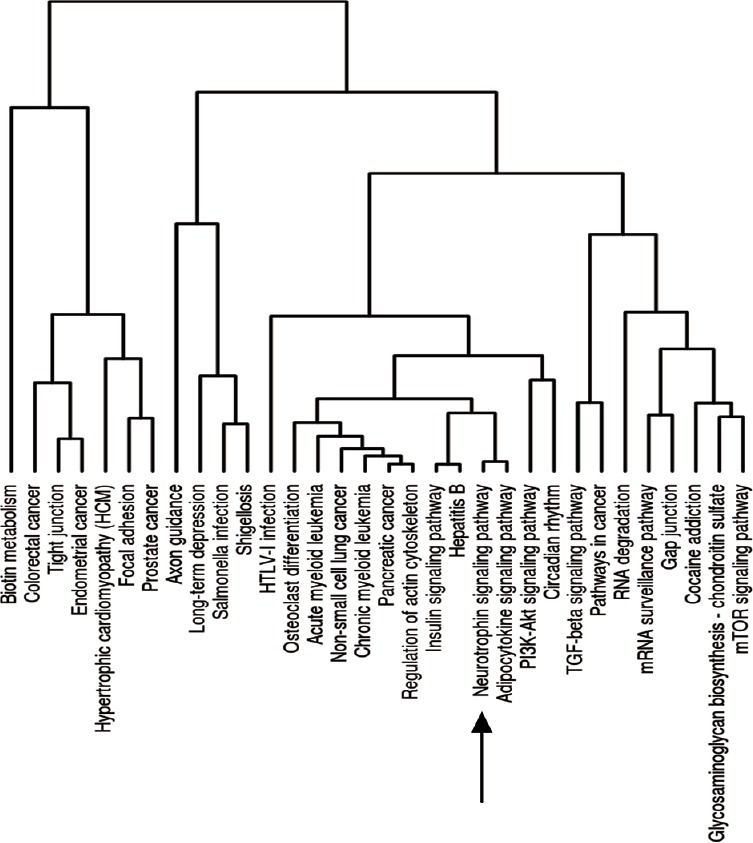
Significantly enriched signaling pathways associated with differentially expressed miRNAs as determined using KEGG pathway cluster analysis.
The neurotrophin signaling pathway is indicated with an arrow.

Significantly enriched signaling pathways associated with differentially expressed miRNAs as determined using KEGG pathway cluster analysis.
The neurotrophin signaling pathway is indicated with an arrow.