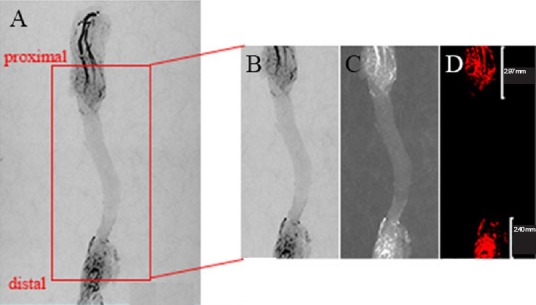
Figure 4.

Micro-CT assessments of vascular density and vascular area at day 7 postoperatively.
A CT image of the acellular nerve graft from the proximal to the distal junction was cropped from the whole vascular graft image in Photoshop (A and B). The graft segment was converted to gray scale and inverted with Image Pro Plus software (C). The visual images were created by selecting the color level using the measure function tool in Image Pro Plus (D). The vascular density and vascular area were automatically calculated. Finally, the regeneration distance was measured on the visual images.
