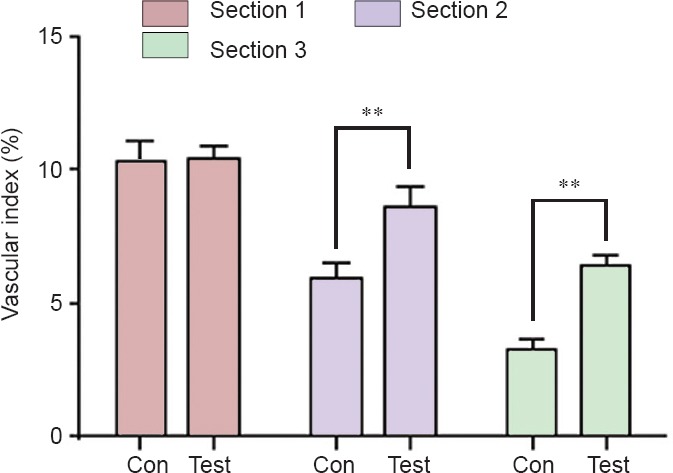
Figure 5.

Vascular index in the control (Con) and test groups at 14 days postoperatively.
In section 1, the vascular index was not statistically different between the Con group and the test group. In sections 2 and 3, the vascular index in the Con group was less than that in the test group. Vascular index = the total area of the vascular development region/cross-sectional area of the nerves × 100%. Data are expressed as the mean ± SD (n = 6). One-way analysis of variance followed by the least significant difference post hoc tests was used. **P < 0.01, vs. Con group.
