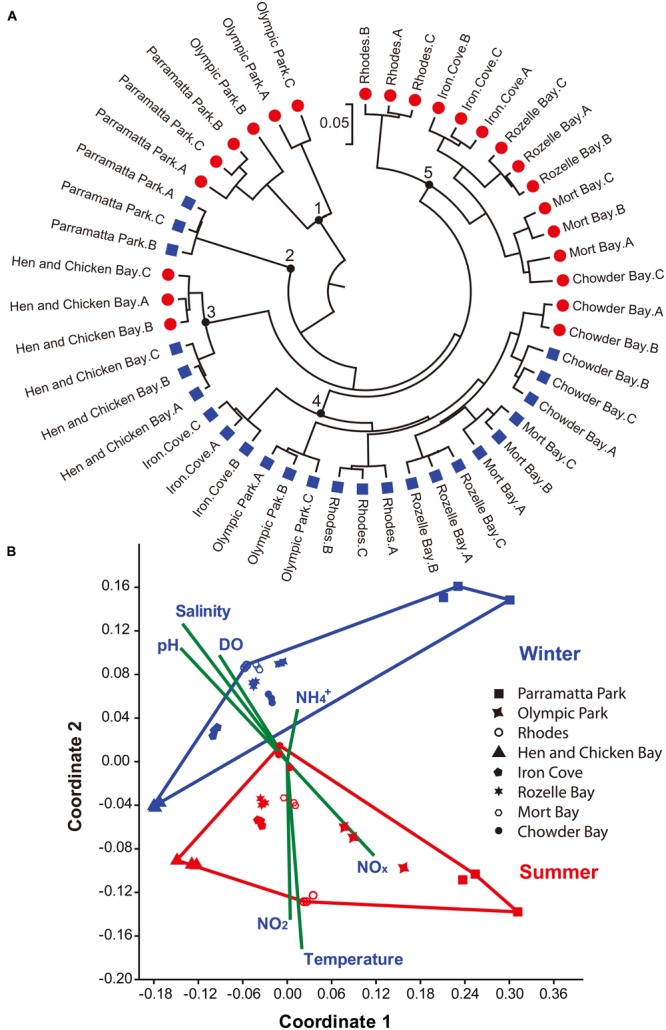
FIGURE 4.

Sample assessment using 16S rRNA gene sequences and environmental parameters. (A) Jackknife Comparison on the weighted sequence data was carried out using QIIME (Caporaso et al., 2010) and constructed with MEGA 6.0 (Tamura et al., 2013). Red circles denote summer (March) and Blue squares denote winter (June) samples. The bar represents five substitutions per 100 nucleotide positions. Black circles numbered 1–5 highlight different groups of sequences. (B) Non-metric MDS plot of the top 50 OTUs. Red and Blue points represent summer and winter samples, respectively. A, B, and C represent the three biological replicates. Shepard plot stress value was 0.1237. Vectors indicate the contribution of each environmental parameter using PAST (Hammer et al., 2001).
