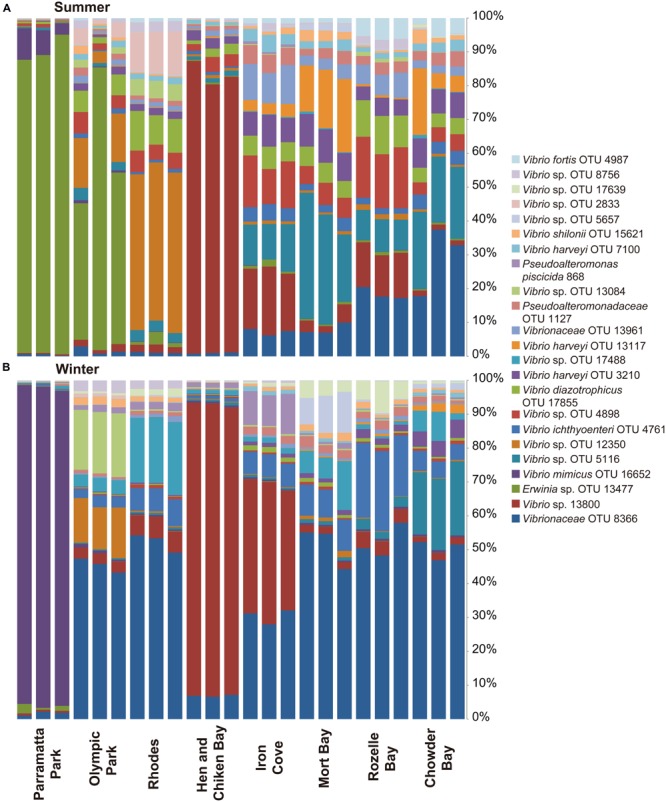
FIGURE 5.

Most abundant Vibrio OTUs (representing 67.5% of the total normalized sequences during winter and summer. The figure displays the distribution of OTUs (for graphical reasons only OTUs that represent >0.5% of the total sequences were included) at the different sites, ranging from Parramatta Park in the west to Chowder Bay in the east: (A) summer sampling time (March), (B) winter (June).
