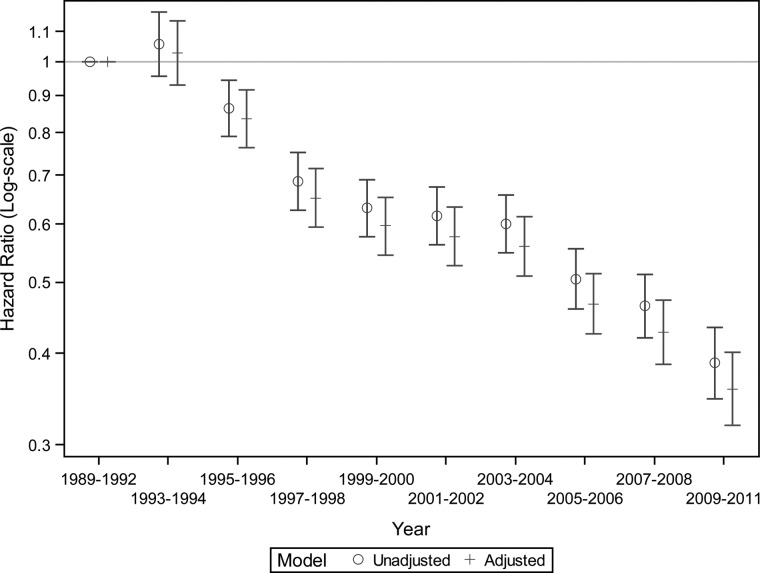
FIGURE 3:
Trends in the survival among incident patients with end-stage renal disease from HIV-associated nephropathy. All hazard ratios are compared to patients with incident ESRD due to HIVAN in 1989–92. Adjusted model included age, sex, race (black, white, other), and geographic location (Northeast, Midwest, South, West). P-value for trend using year as a continuous variable, <0.001.

