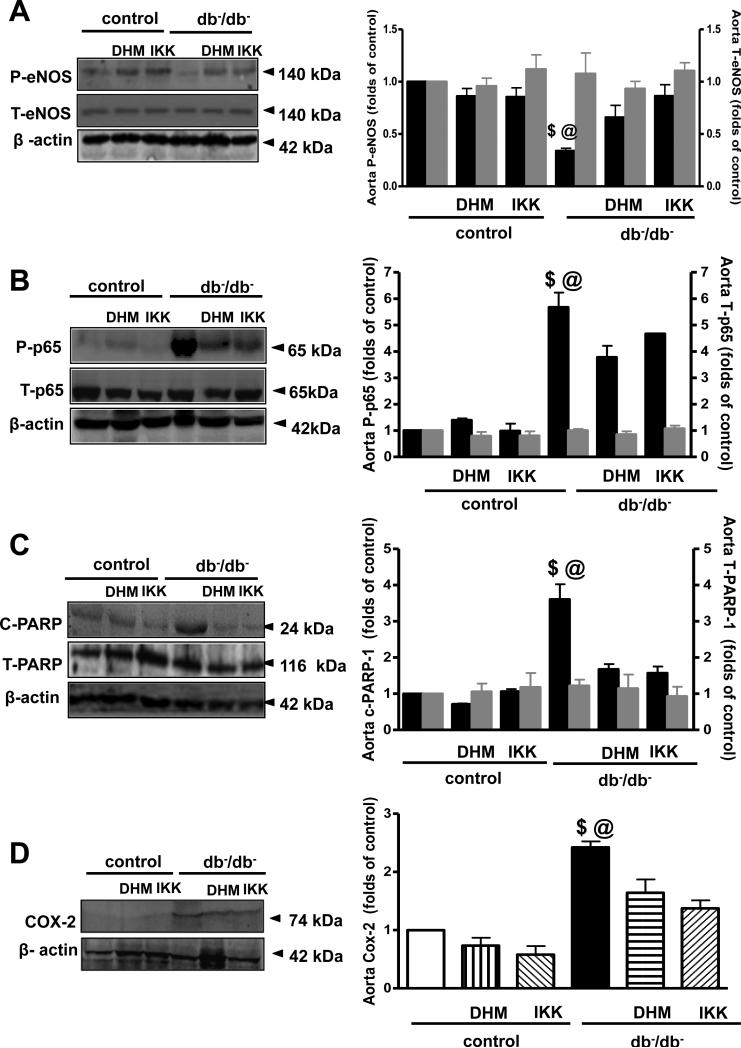
Figure 2.
Western blot analysis and quantitative data (n=5), in homogenized aorta from control and type 2 diabetic mice (db−/db−) treated with or without DHMEQ or IKK-NBD, showing phosphorylated P-eNOS, total T-eNOS (A) phosphorylated P-p-65, total T-p-65 (B), cleaved c-PARP-1 and total T-PARP-1 (C), COX-2 (D) and β-actin. $P< 0.05 for db−/db− vs. control, control treated with DHMEQ or IKK-NBD, db−/db− treated with DHMEQ or IKK-NBD.
@P< 0.05 for db−/db− vs. db−/db− treated with DHMEQ or IKK-NBD

