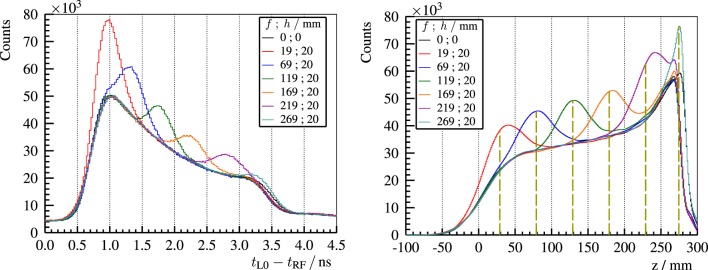
Figure 15.
Left: experimental PGT spectra of the L0 detector for 230-MeV protons and a bone insert inside the full (400-mm) PMMA target at f and h (front face position and thickness as described in Figure 10). Right: time to distance axis conversion from the left PGT spectra after application of stopping power, sensitivity, and gamma time-of-flight corrections as well as background subtraction. z refers to the depth with respect to the target’s front face (beam entrance point). Vertical dashed lines mark the centroid of the bump according to the simBox model. Reproduced with permission from Ref. (29).

