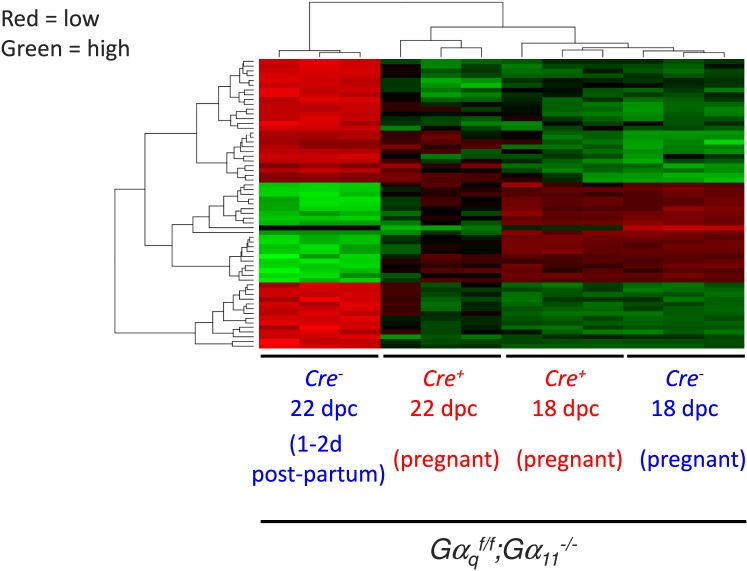
FIG. 2.
Heat map of ovarian gene expression in Gαqf/f;Gα11−/−;Cre− and Gαqf/f;Gα11−/−;Cre+ mice on 18 and 22 dpc. The probes included in this heat map were first selected by comparing gene expression in the Gαqf/f;Gα11−/−;Cre− mice on 22 and 18 dpc. On 18 dpc Gαqf/f;Gα11−/−;Cre− and Gαqf/f;Gα11−/−;Cre+ mice are pregnant. On 22 dpc the Gαqf/f;Gα11−/−;Cre+ mice are still pregnant but the Gαqf/f;Gα11−/−;Cre− mice are 1–2 days postpartum. Only those probes that were differentially expressed with a P < 0.001 were chosen. This list was sorted again based on the extent of the differential expression, and only those probes that were differentially expressed by at least two orders of magnitude (100-fold) are shown. An increase in expression is shown by the different shades of green, and a decrease in expression is shown by the different shades of red. The clusters shown contain duplicate probes and probes for unknown genes. The identity of the up- and down-regulated genes (after removal of duplicate probes and probes for unknown genes) is shown in Tables 1 and 2.

