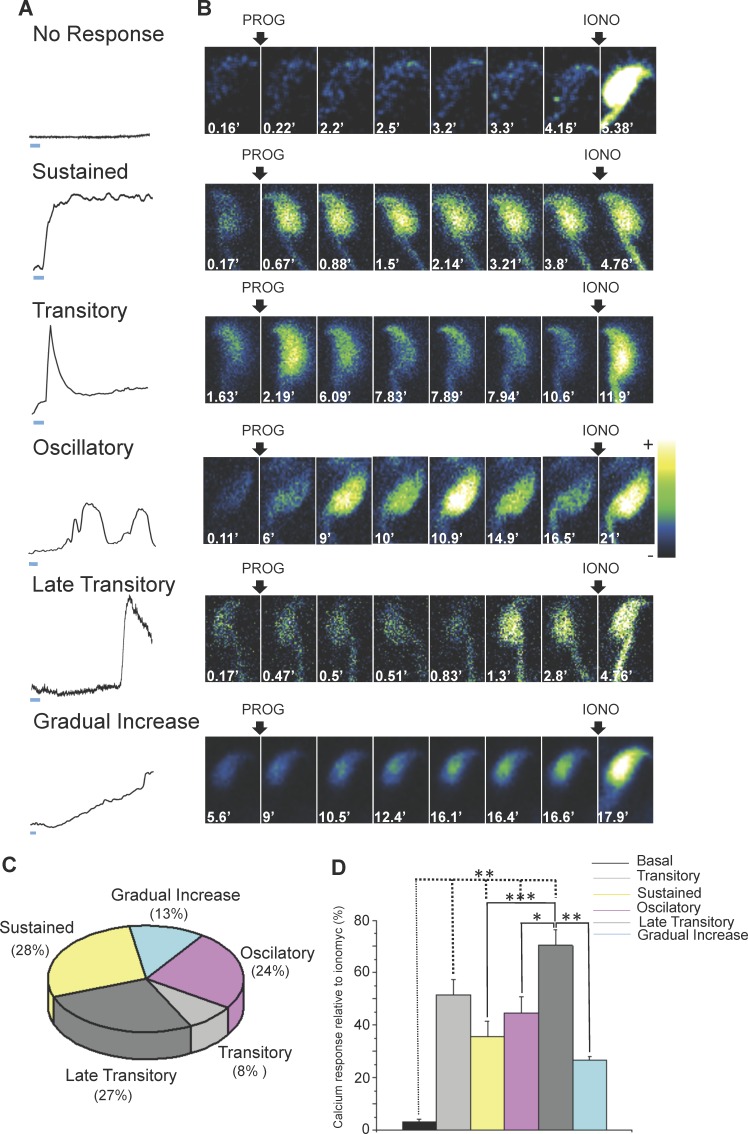
FIG. 2.
Mouse sperm displayed different patterns of [Ca2+]i increase in response to progesterone. A) Graphics representing the different patterns of [Ca2+]i increase observed in the sperm head as a result of the addition of 100 μM progesterone (PROG). According to the calcium response, the patterns of increase were classified as sustained, transitory, oscillatory, late transitory, and gradual increase. The bar below the traces represents the time scale = 1 min. B) Representative time lapse images of Fluo-4 AM-loaded sperm following the addition of 100 μM progesterone and 10 μM ionomycin (IONO). C) Percentage of sperm displaying each of the patterns observed. These results were obtained by analyzing 184 sperm from 10 mice. D) Comparison of the calcium increase in response to progesterone normalized by the ionomycin response. These results were obtained by analyzing 184 sperm from 10 mice; statistically significant differences at *P < 0.05, **P < 0.01, and ***P < 0.001.

