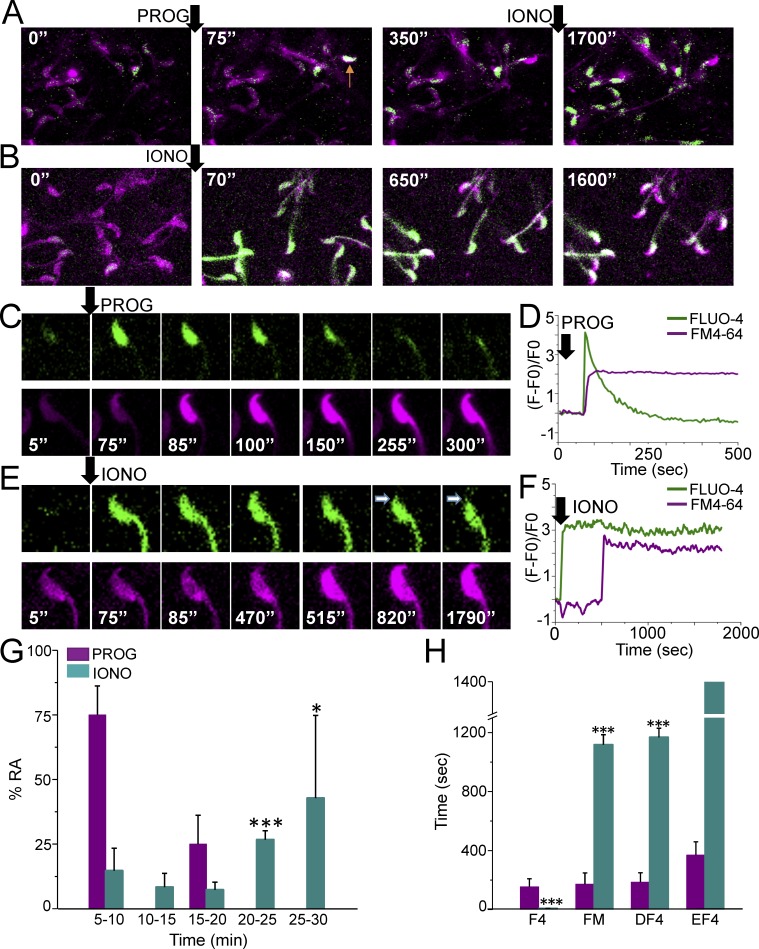
FIG. 6.
[Ca2+]i and AR alternate measurements in mouse sperm. A and B) Fluo-4 AM and FM4-64 fluorescence from sperm exposed to progesterone (PROG) or ionomycin (IONO), respectively. The arrow in the panel corresponding to 75 sec indicates a sperm that increased its [Ca2+]i and underwent AR (arrow in panel corresponding to 350 sec). C) Representative alternate Fluo-4 AM and FM4-64 fluorescence images of a sperm undergoing a progesterone response. C) Fluo-4 AM and FM4-64 fluorescence changes observed in the sperm displayed in D. E) Alternate Fluo-4 AM and FM4-64 fluorescence images of a representative sperm responding to ionomycin. F) Fluo-4 AM and FM4-64 fluorescence changes observed during the recordings of the sperm shown in E. G) Percentage of AR stimulated by progesterone or ionomycin at different times (AR time was established as the time that FM4-64 fluorescence significantly increased); n = 8 mice, 21 reacted cells and n = 4 mice, 43 reacted cells for progesterone and ionomycin experiments, respectively. Statistically significant differences between the progesterone and ionomycin response at *P < 0.05 and **P < 0.001. H) Average time at which the indicated processes occurred after progesterone or ionomycin stimulation: F4 (delay for Fluo-4 AM fluorescence increase), FM (delay for FM4-64 fluorescence increase), DF4 (delay for Fluo-4 AM fluorescence decrease), EF4 (delay for complete loss of Fluo-4 fluorescence in the head); n = 8 mice, 21 reacted cells and n = 4 mice, 43 reacted cells for progesterone and ionomycin experiments, respectively. Statistically significant differences between progesterone and ionomycin responses (***P < 0.001).

