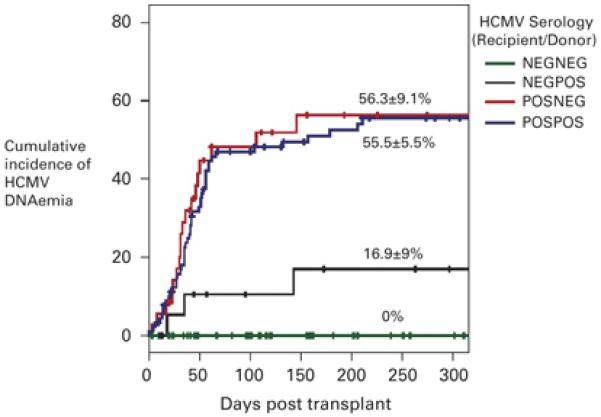
Figure 2. Kaplan Meier estimate of the cumulative incidence of HCMV DNAemia stratified according to HCMV serology.

The R−D− group (n=56, green line) did not experience any episodes of DNAemia. The cumulative incidence of DNAemia of the R−D+ group (n=20, black line) was 16.9 ± 9 %, the R+D− group (n=36, red line) was 56.3 ± 9.1 % and the R+D+ group (n=91, blue line) was 55.5 ± 5.5 %. The difference in the incidence of HCMV DNAemia between the R−D+ group, and the R+D− and R+ D+ groups was statistically significant (p = 0.009 for R+D− group and p = 0.007 for R+D+ group when compared with the R−D+ group, Log Rank Score). There was no statistically significant difference in DNAemia rates between the R+D− group and the R+D+ group (p = 0.71, Log Rank Score). The cross bars indicate censored events.
