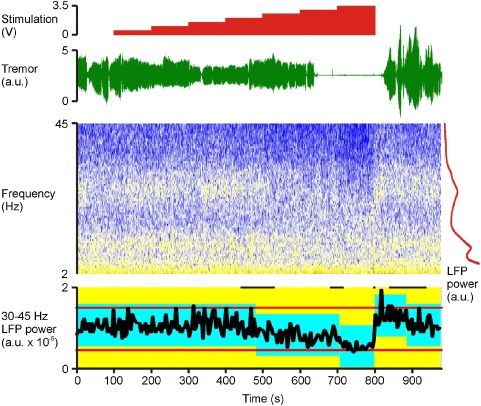
Figure 1.

Example recording (case 3). Time‐evolving STN LFP spectrum and contralateral upper limb tremor are shown, together with the timings of incremental changes in stimulation. No stimulation is applied at the beginning and end of the recordings. The LFP is shown as a spectrogram, with cold colors representing lowest power (so blue, white, yellow, and then red reflect increasing power). To the right of time‐evolving spectrogram is a time‐averaged LFP power spectrum in red demonstrating discrete peaks at twice tremor frequency (10 Hz) and in the beta band (peaking at 26 Hz), but no such discrete peak in the low gamma (31–45 Hz) band. Onset and offset of tremor suppression is delayed for a few seconds after corresponding voltage changes. In contrast, return of gamma power to baseline levels is very rapid upon cessation of stimulation. Below the time‐evolving spectrogram (bottom trace) is the control chart of the 31–45 Hz LFP power estimated in nonoverlapping 4 sec blocks. Red horizontal lines either side of the power trace in black are the control limits of the whole recording. The blue blocks represent periods of constant 31–45 Hz power identified by change‐point analysis (p < 0.01) 23. The vertical extent of the blue blocks denotes the 99% confidence limits centered on the mean of each stable period. Short black horizontal lines at the top are the 99% confidence limits of the changes in gamma power (10,000 bootstraps). Change‐point analysis independently confirms that gamma power was reduced around the time of increasing stimulation voltage to 2.5 V and 3.5 V. Gamma power then rebounded when stimulation was stopped. Stimulation was delivered at 130 Hz with 90 μsec pulse width and applied at contact 1. The LFP was recorded from contacts 02 on the right. The tremor was recorded with an accelerometer taped to the dorsum of the left (contralateral) hand. LFP, local field potential; STN, subthalamic nucleus.
