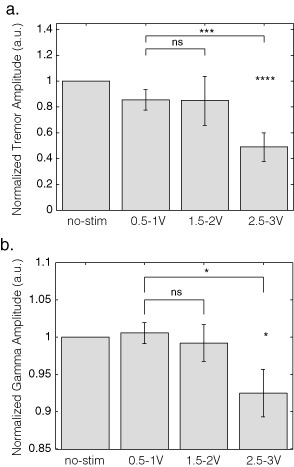
Figure 2.

Average amplitudes of (a) tremor and (b) 31–45 Hz activities over the different stimulation ranges. Data are normalized to the no‐stimulation condition (left column). Vertical gray bars depict mean values and the black stripes the standard error of this mean. a.u., arbitrary units; no‐stim, no‐stimulation; ns, nonsignificant. *p < 0.05; ***p < 0.005; ****p < 0.001.
