Figure 3.
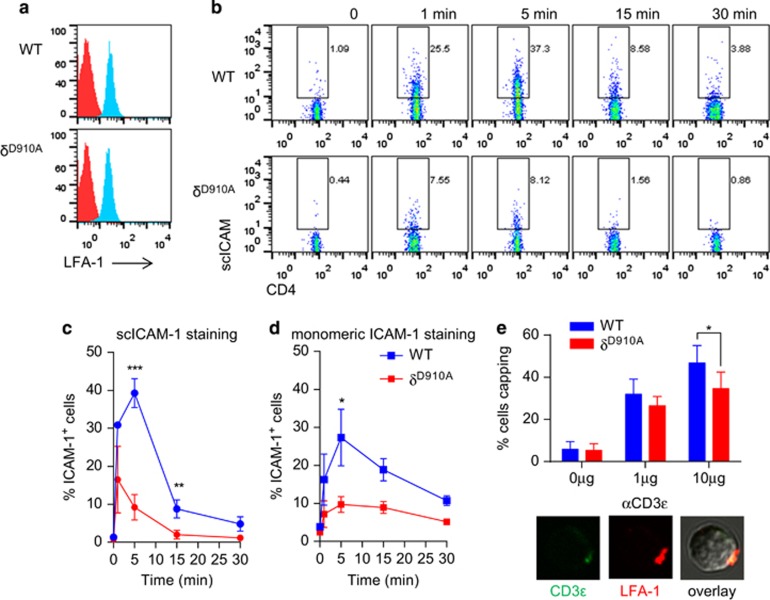
Impaired TCR-induced LFA-1 activation in p110δD910A T cells. (a) Expression level of LFA-1 on WT and p110δD910A CD4+ T cell is shown. (b, c) CD4+ T cells were incubated with sc-ICAM-1 and stimulated with anti-CD3ɛ. After the indicated times, the reaction was stopped with 4% PFA. Bound scICMA-1 was detected by flow cytometry. (b) Dot plots of a representative experiment are depicted. The percentage of positive cells for ICAM-1 is shown (c). Data show means of three independent experiments. (d) Reduced LFA-1 affinity in p110δD910A T cells. CD4+ T cells were incubated with monomeric ICAM-1 Fc and stimulated with anti-CD3ɛ. Bound ICAM-1 Fc was detected by staining with Fc-specific PE-labelled F(ab')2 fragment. Data show means of three independent experiments. (e) p110δD910A T cells show normal LFA-1 capping. Cells were stimulated with anti-CD3 and LFA-1 was visualised with a PE-labelled anti-CD11a. Histogram show percentage of T cells presenting a LFA-1 cap. Pictures show examples of LFA-1 distribution on activated T cells.

