
Figure 5. Quality control of pooled samples or reference samples: column and detector saturation.
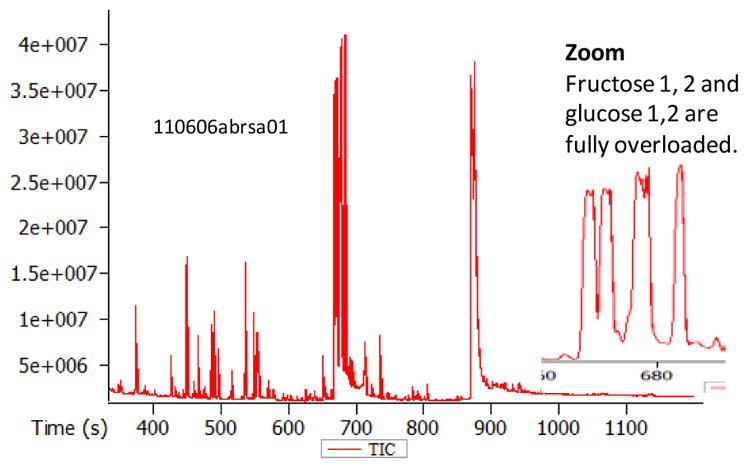
Example chromatogram for overloaded injection of a plant extract. If too much sample is injected, peak intensities exceed column and detector capacities. For such overloaded peaks, any quantitative readout is impossible, as shown here for fructose and glucose. Note that metabolites that bear keto- or aldehyde groups like these two sugars form two peaks due to the methoximation reaction.