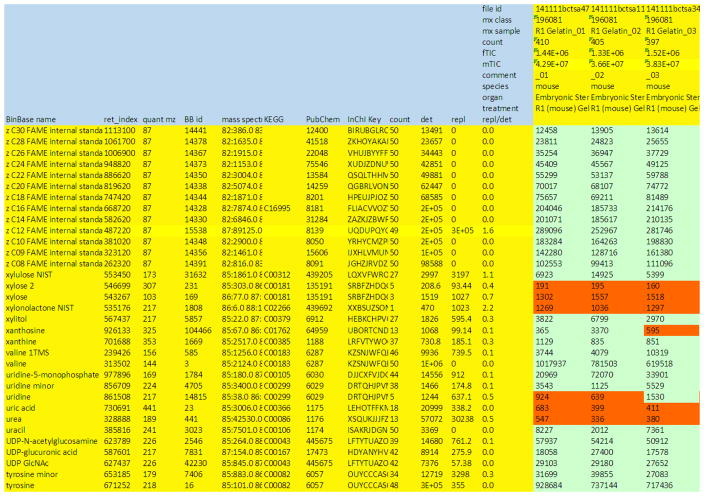
Figure 7. Example sheet to report raw result data.
Results may need to be further curated before final submission and input for statistics and bioinformatics research. Given here is a result sheet from a Leco GC-TOF MS instrument with Fiehnlab BinBase database annotations (Fiehn et al, 2005). Rows: The compound annotation must include the chemical name, at least one unique database identifier (here: structural InChI key (Heller & McNaught, 2009)), metadata on which the compound annotation is based (here: retention index, quantification mass, BinBase identifier and full mass spectrum, encoded as string), and bioinformatics keys such as KEGG (Kanehisa & Goto, 2000)and PubChem (Bolton et al, 2008). For curation, this raw results sheet also lists how often each peak was confidently identified in the experiment (‘count’), how abundant these peaks were on average (‘det’), and if these were not confidently detected, how abundant the replaced values were (from raw chromatograms), ‘repl’. Values that have been replaced are marked in orange color. The data curator decides which peaks would be deleted, e.g. xylonolactone that was only positively detected in 1/50 samples. If two or more peaks annotate the same unique metabolite, these rows are added up (e.g. valine + valine 1TMS). Columns: For each sample, the raw file identifier must be given in addition to all available biological information such as species, organ and treatment. Here, the columns also denote the LIMS identifiers (mx), the count of confidently identified peaks (count), the sum peak height of the internal standards (fTIC) and the sum peak height of all structurally annotated compounds (mTIC) as sum parameter for normalizations.

