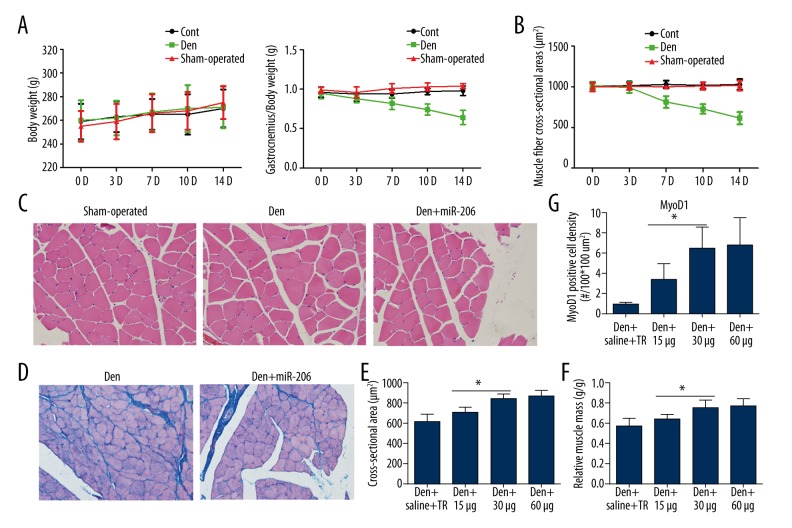
Figure 1.
Progression of denervation-induced muscle atrophy and improvement following miR-206 treatment. (A) Body weight and gastrocnemius relative muscle mass in the control, sham-operated, and Den groups 0 d, 3 d, 7 d, 10 d, and 14 d after surgery. (B) Changes of muscle fiber cross-sectional area in the control, sham-operated, and Den groups at 0 d, 3 d, 7 d, 10 d, and 14 d after sciatic nerve transection. (C) Histochemical staining (H&E) of GM for the sham-operated, Den, and Den+miR-206 groups. Normal muscle cell with round appearance and similar size are found in the sham-operated group. In the Den group, some cells show a polygonal shape, and a small number of hypertrophic and atrophic cells appear. In the Den+miR-206 group, the muscle cells show a less-rounded appearance. (D) Comparison of collagen fiber production between the Den and Den+miR-206 groups, as revealed by Masson’s trichrome staining. In the Den group muscle fibers were surrounded by collagen fibers, whereas in the Den+miR-206 group the production of collagen fiber was weakened. (E, F) Quantification of the cross-sectional area and gastrocnemius relative muscle mass (operated limb/normal limb) 14 d after surgery, as shown in Supplementary Figure 1. * P<0.05 in the miR-206 treatment group vs. Den+saline group. (G) Quantification of MyoD1 positive cell density, as shown in Supplementary Figure 2 in the Den+saline+RT (transfection reagent) and miR-206 treatment group (15 μg/rat, 30 μg/rat, and 60 μg/rat). * P<0.05.

