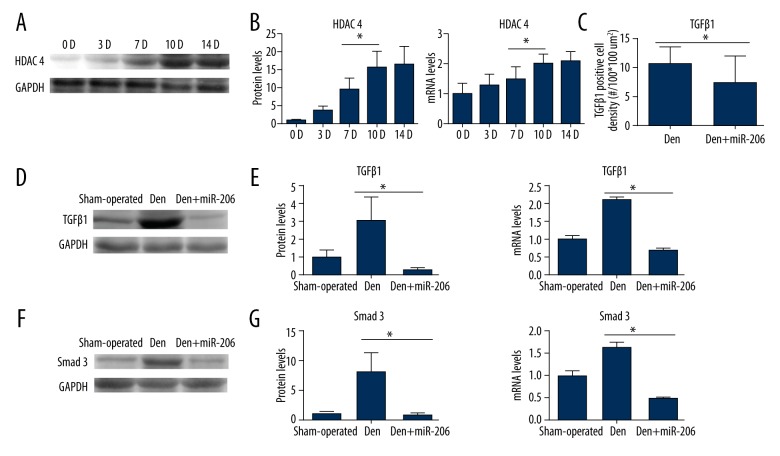
Figure 3.
Expression of TGF-β1, Smad3, and HDAC4 in the GM following denervation-induced muscle atrophy. (A) Western blot analysis results showing the expression of HDAC4 protein levels 0 d, 3 d, 7 d, 10 d, and 14 d after sciatic nerve transection in comparison to GAPDH controls. (B) Quantification of Western blot and RT-PCR results showing protein and mRNA expression levels of HDAC4 at 0 d, 3 d, 7 d, 10 d, and 14 d after sciatic denervation surgery. (C) Quantification of immunofluorescence staining, as shown in Supplementary Figure 3, displaying TGF-β1 positive cell densities (#/100*100 um2). * P<0.05. (D–G) Representative Western blot for TGF-β1 and Smad3 expression in the sham-operated, Den, and Den+miR-206 groups. Quantification of Western blot and RT-qPCR results show relative protein and mRNA level of TGF-β1 and Smad3 expression in the sham-operated, Den, and Den+miR-206 groups. n=4, per group; * P<0.05.

