Figure 1.
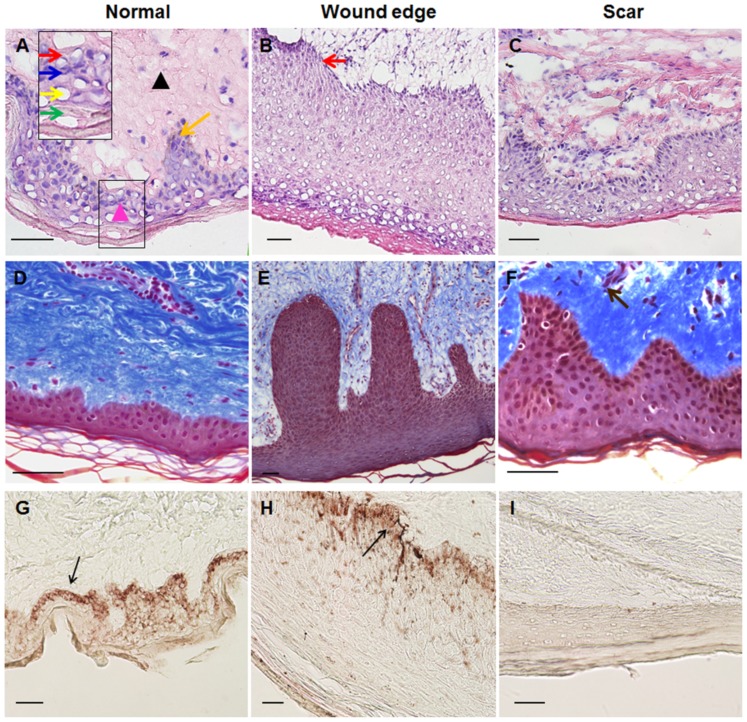
Morphological differences between normal, wound edge and hypertrophic scar tissues. (A–C) Hematoxylin and eosin (H&E) staining was performed to visualize the histological structures in normal, wound edge and scar tissues. (A) In the normal skin sample, the histological structure of the skin was visible, showing layers of the epidermis and dermis. The epidermis contained 4 to 5 layers of keratinocytes. In the underlying dermis, fibroblasts made up loose connective tissue, which was rich in parallel collagenous fibers (D). Inset shows a close-up view of area within the black markings. Black triangle denotes dermis, while pink triangle denotes epidermis. Orange arrow denotes rete ridge. Red arrow denotes basal keratinocytes. Blue arrow denotes spinous cells. Yellow arrow denotes granular cells. Green arrows denote cornified cells. (B) In the wound edge tissue sample, the epidermis proliferated and was of increased thickness and was comprised of multiple layers of keratinocytes of distinct morphology. Red arrow denotes basal keratinocytes, which arranged as a regimented single layer of cuboidal or low columnar cells. (C) The histological structure of hypertrophic scar tissue differed from normal skin by having a rich blood supply, high mesenchymal density, and a thick epidermal layer. The dermis was composed largely of dense, disorganized connective tissue that includes tough collagenous fibers of an irregular shape and a larger diameter. (D–F) Masson's staining was performed to visualize the distribution of collagen fibers in (D) normal, (E) wound edge and (F) scar tissues. Brown arrow denotes tough collagens with rich blood supply. (G–I) Methenamine silver staining was performed to detect the basement membrane (BM) structure in (G) normal, (H) wound edge and (I) scar tissues. BM was present in normal and wound edge tissue, but absent in scar tissue. (G and H) Black arrows denote the BM. All scale bars represent 50 μm.

