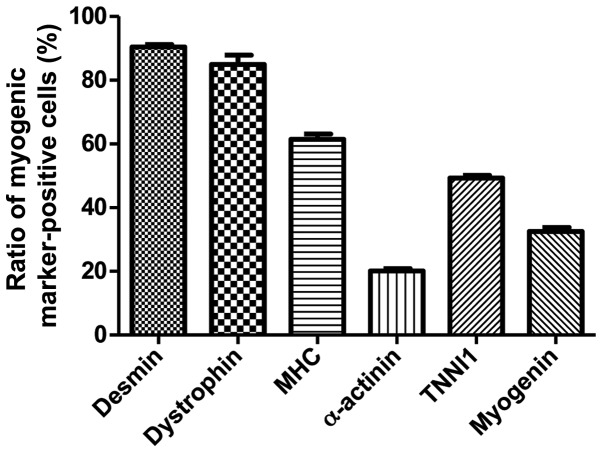
Figure 5.
Quantification of immunofluorescence staining confirmed that during the process of myogenic differentiation, the expression of the myogenic markers, indicating the differentiation potential of T-MSCs to form myoblasts. Data are the means ± SEM. For each condition, 4 slides were used for quantification. Graphs represent the average of multiple tests from 3 independent experiments.

