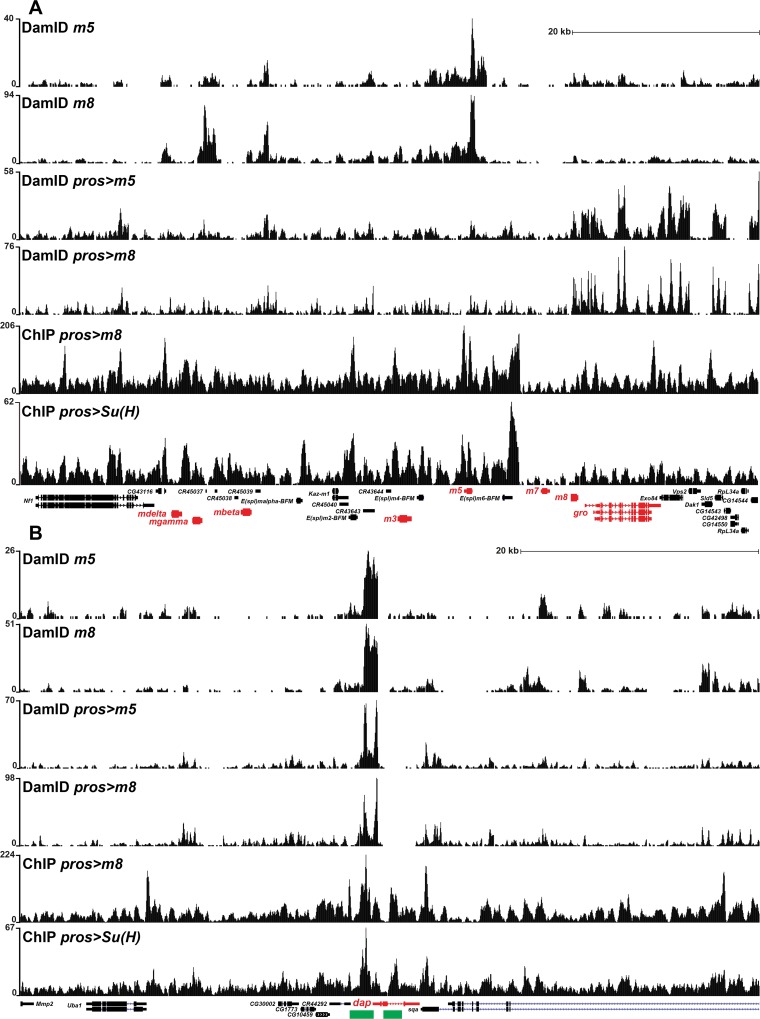
Fig 6. ChIP and DamID analysis of Su(H), m5 and m8 reveals binding to the E(spl) complex and dacapo.
(A-B) Normalized binding profiles for ChIP of FLAG-tagged Su(H) and m8CK2, driven by pros-Gal4, as well as DamID, driven by pros-Gal4 or “un-driven”, for m5 and m8. Depicted is the dap gene and the E(spl) complex. (A) A complex prolife of peaks were detected on the E(spl) complex. (B) Two major peaks were detected on dap in all six conditions tested, and for all three proteins. These two peaks correspond to previously identified dap CNS enhancers (green) [66, 67].

