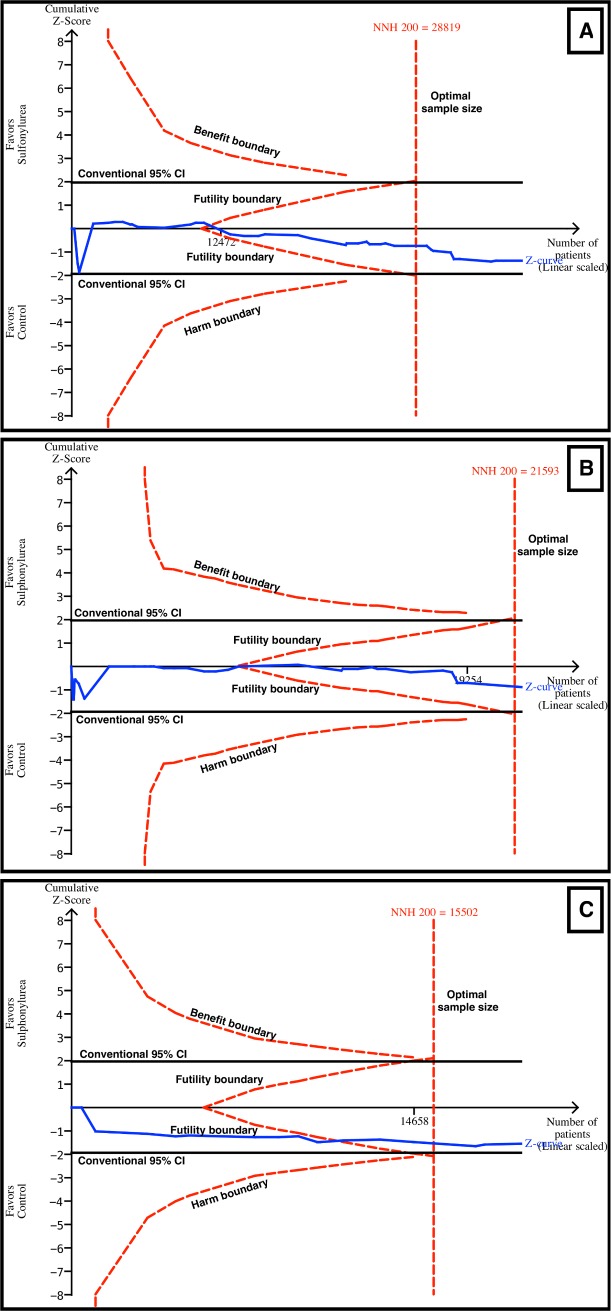
Fig 6. TSA for all-cause and cardiovascular mortality.
TSA discarded harm with sulfonylurea use with an α of 5%, a β of 80%, and an absolute difference of 0.5% between the groups (sulfonylurea and comparator). The blue line represents the Z curve (cumulative effect size), the red dashed lines represent the harm, benefit, and futility boundaries and the estimated optimal sample size adjusted to sample size and repeated analysis, and the black lines represent the conventional confidence intervals. The black number and marking in the x-axis represent the number of patients accrued until that point. (A) Sulfonylureas overall for all-cause mortality. Futility and optimal sample size boundaries were crossed. (B) Sulfonylureas overall for cardiovascular mortality. Futility and optimal sample size boundaries were crossed. (C) Sulfonylureas as add-on to metformin for all-cause mortality. Futility and optimal sample size boundaries were crossed.

