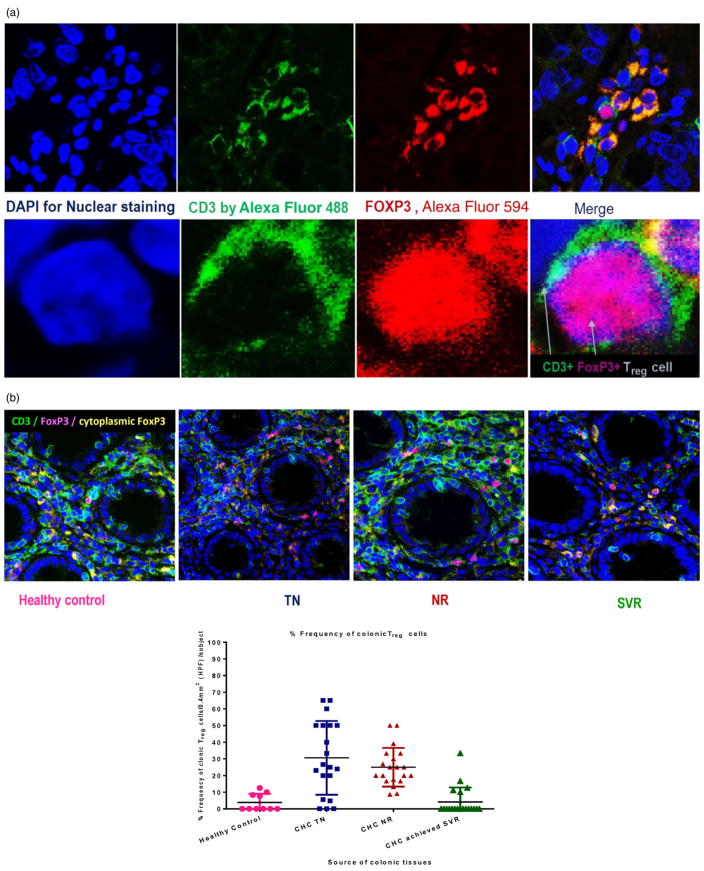
Figure 2.
Characterization of colonic regulatory T (Treg) by double immunofluorescence (IF) staining with anti CD3 and anti-Forkhead box protein P3 (FoxP3) antibody. Colonic Treg cells were detected by indirect fluorescent immunohistochemical staining of CD3 and FoxP3 using mouse monoclonal Anti-CD3 antibody [PS1] and rabbit monoclonal Anti-FOXP3 antibody [SP97]. Treg cells identified by the green surface CD3 (by Alexa Fluor® 488-Donkey Anti-Mouse secondary antibody) and the red nuclear FoxP3 (by Alexa Fluor® 594 Donkey Anti-Rabbit secondary antibody). FoxP3 also was expressed intracytoplasmic in some proliferation cells and appeared as orange color because of the merge between red FoxP3 and green CD3 (a). The frequency of colonic Treg cells in the study groups was plotted in panel b. Significant increase in the frequency of colonic Treg in patients with chronic hepatitis C (CHC) naïve to treatment was observed compared with healthy control and sustained virologic response (SVR) (P = 0.0009 and P < 0.0001, respectively). Additionally, the frequency of colonic Treg was significantly higher in non-responders (NR) compared with healthy controls, and SVR (P < 0.0001 and P < 0.001). No significant differences were observed in the frequency of colonic Treg in SVR group compared with healthy subjects or in the NR group compared with CHC naïve to treatment.

