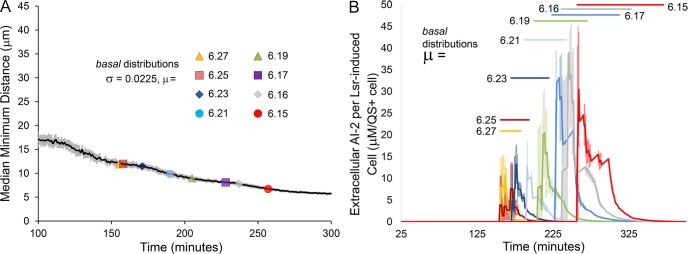
Fig 8. Competing influences on fractional autoinduction.
(A) The median minimum cell-cell distance over time for swimming cells. The dark line is an average value (n = 20), and the surrounding lighter shade the corresponding standard deviation. Along the line are markers representing the time points at which induction began given different mean values of the distribution for the parameter basal. (B) The concentration of extracellular AI-2 per Lsr-induced cell from simulations using distributions of the parameter basal with different means. Each curve represents an average from three different simulations of swimming cells.

