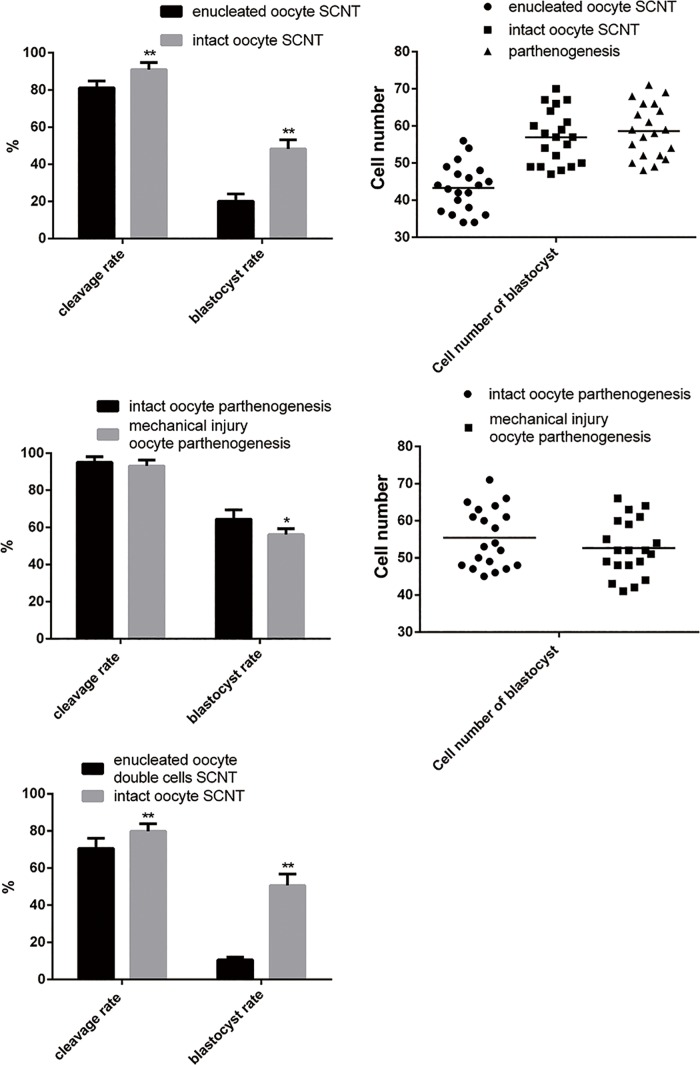
Fig 2. Graphical representations of the developmental capacity of traditional SCNT embryos and intact oocyte SCNT embryos.
(a) Cleavage rate and blastocyst rate of enucleated oocyte SCNT and intact oocyte SCNT. (b) Number of cells in blastocysts generated from parthenogenesis, enucleated oocyte SCNT, and intact oocyte SCNT. (c) This cleavage rate and blastocyst rate in parthenogernesis are affected by the mechanical trauma associated with parthenogenesis. (d) The number of cells in blastocysts generated from intact oocyte parthenogenesis and mechanical trauma oocyte parthenogenesis. (e) The cleavage rate and blastocyst formation rate of intact oocyte SCNT after genome exchange.

