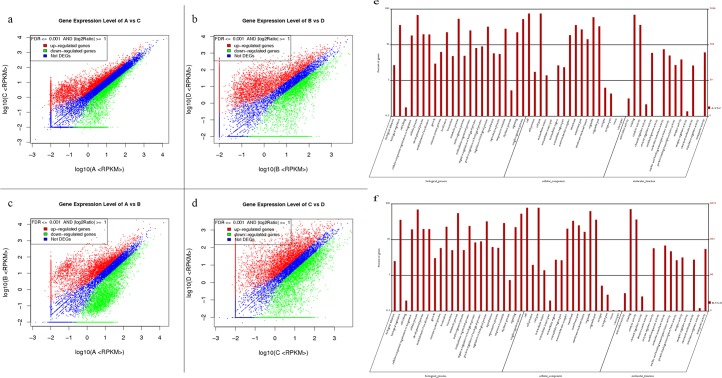
Fig 5.
Scatter plot of DEGs in (a) A vs. C; (b) B vs. D; (c) A vs. B; (d) C vs. D and GO functional classification of DEGs in (e) A vs. C and (f) B vs. D. Note: For A vs. C, A is the control group. Red points indicate genes up-regulated in C relative to A, green points represent genes down-regulated in C relative to A, and blue points represent genes that showed no differences or fold change below 2.

