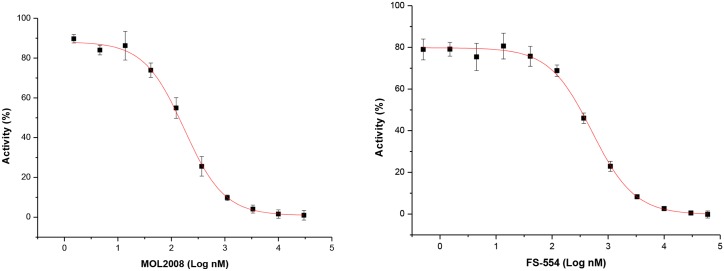
Fig 4. Inhibition plot of Leishmania infantum trypanothione synthetase (TryS) by paullones.
The data are presented as mean TryS activity (%) ± 2 S.D. (n = 4) as function of Log10 concentration (nM) of compound adjusted to a four-parameter Boltzmann sigmoidal equation. Representative dose-response plot obtained for MOL2008 (IC50 = 0.14 ± 0.03 μM; slope plot 0.38 ± 0.03) and for FS-554 (IC50 = 0.32 ± 0.73 μM; slope plot 0.37 ± 0.03).

