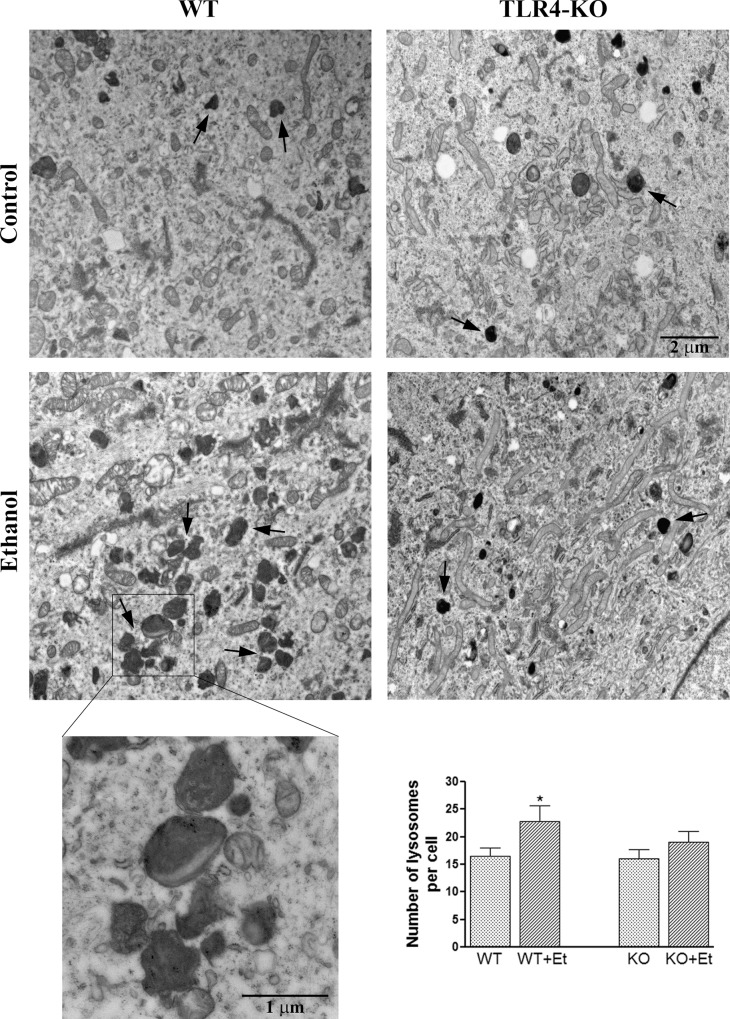
Fig 3. The electron microscopy analysis shows that ethanol treatment increases the number of lysosomes in the WT astrocytes.
Representative transmission electron micrographs of the cortical WT and TLR4-KO astrocytes in the culture treated with or without ethanol for 24 h are shown. Arrows indicate lysosomes. Data represent mean ± SEM, n = 3–4 independent experiments.* p < 0.05 as compared to the untreated WT astrocytes.

