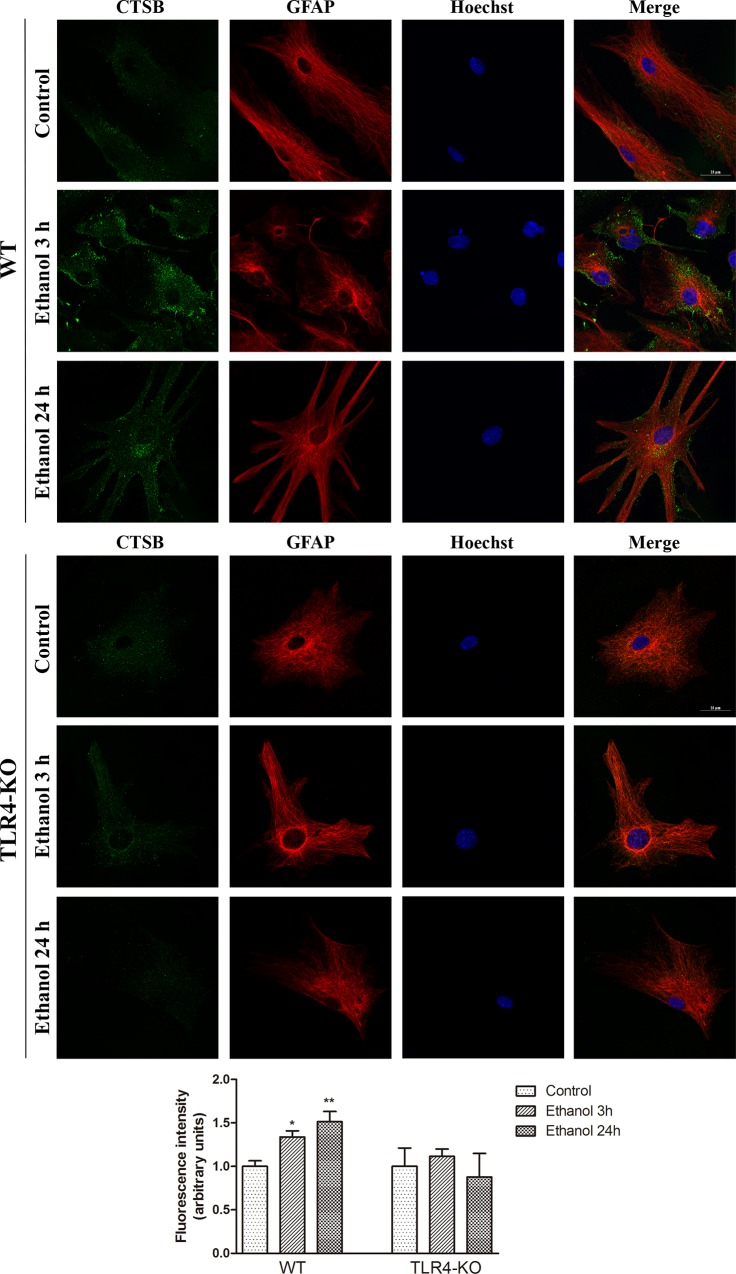
Fig 4. The fluorescence microscopy analysis of cathepsin B in the ethanol-treated WT and TLR4-KO astrocytes.
The double-labeling immunofluorescence of cathepsin B and GFAP in the WT and TLR4-KO astrocytes treated with or without ethanol for 3 and 24 h. A representative photomicrograph is shown. Scale bars represent 25 μm. The fluorescence intensity of cathepsin B was quantified using the ImageJ software. Results are the mean ± S.E.M. of data from 4 different fields per condition from 3 different cell cultures. * p < 0.05, ** p < 0.01 vs. the control group.

