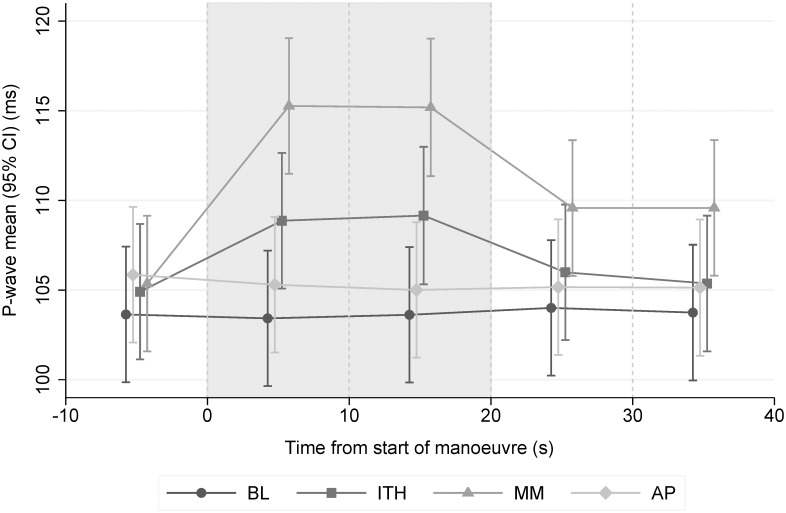
Fig 1. Mean P-wave duration measured in a single lead over all sectors (95% CI).
The two sectors which comprise the manoeuvres are shaded grey. We observed significant differences for ITH and MM vs BL during the manoeuvre (both p<0.001). The P-wave duration did not change during the course of the BL (p = 0.99) and AP (p = 0.94) manoeuvre. All analyses were adjusted for PAF status, heart rate, age, BMI, and sex. BL = baseline (normal breathing). ITH = inspiration through a threshold load (simulating an obstructive hypopnea). MM = Mueller manoeuvre (simulating an obstructive apnea). AP = end-expiratory breath holding (simulating central apnea).

