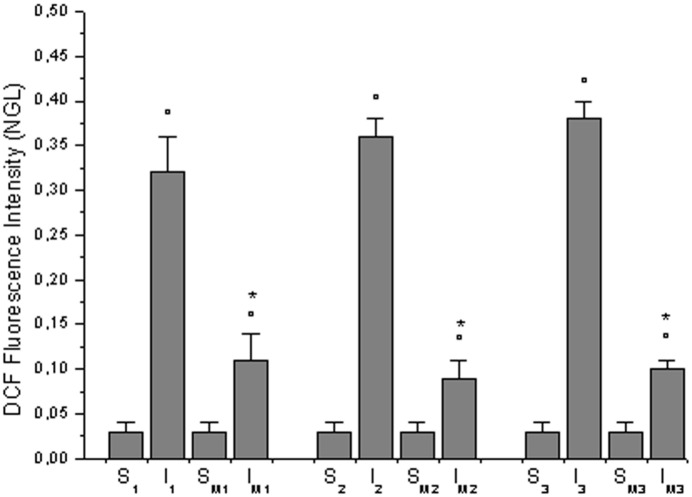
Fig 5. ROS formation.
Changes in DCF fluorescence intensity at the end of BCCAO and reperfusion in sham-operated subgroups (S1, S2, S3, SM1, SM2 and SM3) and in hypoperfused subgroups: I1, I2, I3, IM1, IM2 and IM3. °p<0.01 vs. baseline and S1, S2, S3, respectively, *p<0.01 vs. SM1, SM2, SM3, respectively.

