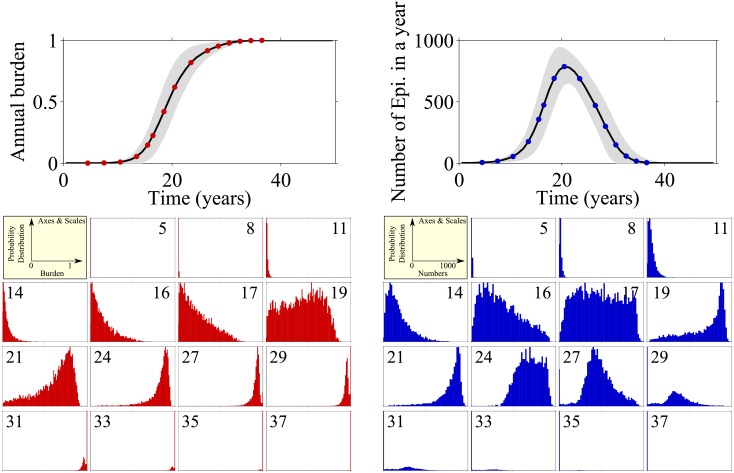
Fig 5. Left: Top panel shows annual AF burden (left) and number of episodes (right) after patient has entered paroxysmal AF.
Horizontal axis indicates time elapsed since onset of paroxysmal AF. The mean of 5000 simulation runs is indicated as solid line, grey area shows the standard deviation. Smaller panels show distribution of burdens (left) and numbers of episodes (right) across the patient population at the indicated points in time (years after onset of paroxysmal AF) in a moving window of 12-months duration.

