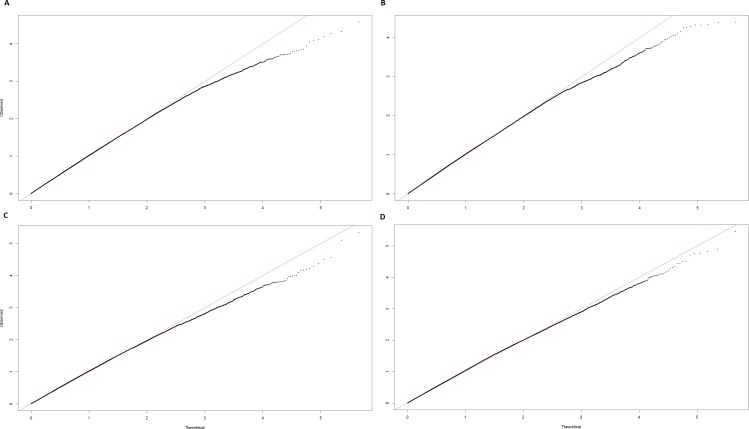
Fig 4. QQ plots for Chromosome 8 (ECA8).
aCorrected QQ plot for the cases and controls structured association analysis; uncorrected λ = 1.3659. bCorrected QQ plot for the cases and controls principal component analysis; uncorrected λ = 1.2599. cCorrected QQ plot for the principal component analysis of IBH severity; uncorrected λ = 1.2657. dCorrected QQ plot for the mixed model-structured association analysis of IBH severity; uncorrected λ = 1.0222.

