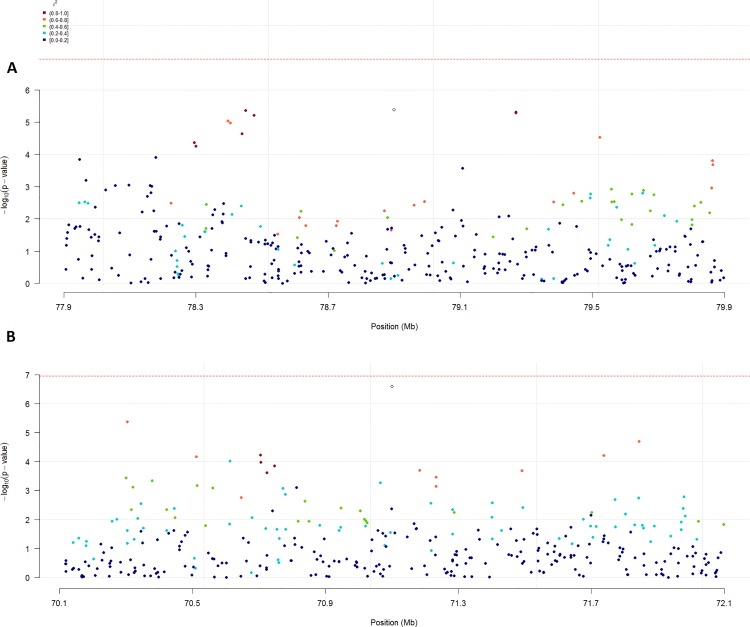
Fig 5. Linkage disequilibrium patterns relative to markers AX-104130346 and AX-104330407.
aLinkage disequilibrium pattern relative to marker AX-104330407 on a Manhattan plot based on the results of the cases and controls principal component analysis. bLinkage disequilibrium pattern relative to marker AX-104130346 on a Manhattan plot based on the results of the principal component analysis of IBH severity

