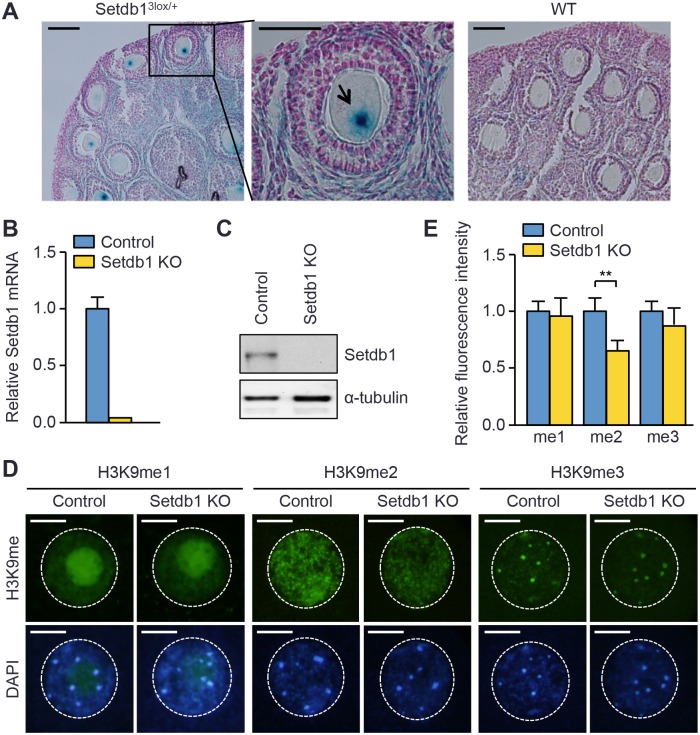
Fig 1. Setdb1 is expressed and controls global H3K9me2 in growing oocytes.
(A) X-gal staining of paraffin-embedded sections of ovaries from 4-week-old Setdb13lox/+ or wild-type (WT) mice. One follicle is enlarged, and the oocyte nucleus is indicated by an arrow. Scale bars, 50 μm. (B) qRT-PCR analysis of Setdb1 transcript. Shown are relative levels of Setdb1 mRNA in control and Setdb1 KO GV oocytes (mean ± SEM of triplicate assays). (C) Western blot analysis of Setdb1 in control and Setdb1 KO GV oocytes, with α-tubulin as a loading control. Each lane contains 150 GV oocytes. (D, E) IF analysis of H3K9 methylation in oocytes. Fully-grown GV oocytes harvested from control and Setdb1 KO mice were immunostained with antibodies specific for H3K9 mono-, di- and tri-methyl (H3K9me1, H3K9me2, and H3K9me3) marks and counterstained with DAPI. (D) Representative images of H3K9me1, H3K9me2, and H3K9me3 marks (green) and DAPI (blue). The nuclei of the oocytes are circled. Note that H3K9me1 is enriched in the nucleoli, H3K9me2 exhibits a punctate staining pattern throughout the nuclei, and H3K9me3 is enriched in constitutive heterochromatin. Scale bars, 10 μm. (E) Quantification of fluorescence intensity of H3K9me1, H3K9me2, and H3K9me3 marks in oocytes. Fifteen oocytes for each genotype were stained by each antibody, and the data are presented as the mean ± SEM. Statistical comparisons were made using unpaired t-test. ** P < 0.01.

