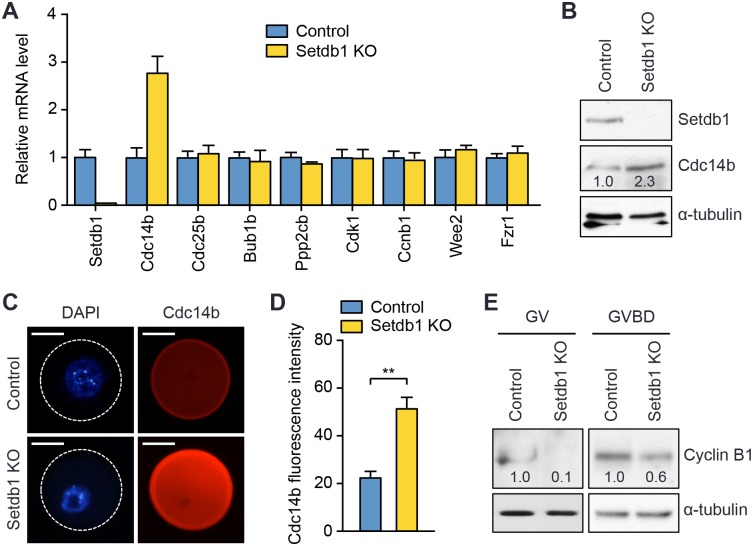
Fig 3. Cdc14b is up-regulated in Setdb1 KO oocytes.
(A) qRT-PCR analyses of Setdb1, Cdc14b, Cdc25b, Bub1b, Ppp2cb, Cdk1, Ccnb1 (encoding cyclin B1), Wee2, and Fzr1 (encoding Cdh1) transcripts in GV oocytes. Shown are relative mRNA levels in control and Setdb1 KO oocytes (mean ± SEM of triplicate assays). (B) Western blot analysis of Setdb1 and Cdc14b in control and Setdb1 KO GV oocytes, with α-tubulin as a loading control. Each lane contains 100 GV oocytes. Relative band intensities were quantified with the ImageJ software and normalized to the α-tubulin signal. (C, D) IF analysis of Cdc14b expression in GV oocytes. (C) Representative images of control and Setdb1 KO oocytes stained with anti-Cdc14b (red) and DAPI (blue). The boundaries of the oocytes are defined by circles. Scale bars, 35 μm. (D) Quantification of fluorescence intensity of Cdc14b. Thirty control and 30 Setdb1 KO oocytes were analyzed, and the data are presented as the mean ± SEM. Statistical comparisons were made using unpaired t-test. **P < 0.01. (E) Western blot analysis of Cyclin B1 in GV and GVBD oocytes. GV oocytes were harvested from control and Setdb1 KO mice. GVBD oocytes were isolated by morphology after culturing GV oocytes in maturation medium for 5 hours. The samples were analyzed by immunoblotting with Cyclin B1 or α-tubulin antibodies. Each lane contains 150 GV oocytes or 85 GVBD oocytes, respectively. Relative band intensities were determined as described above, with the values in control samples being arbitrarily designated as 1.0.

