
Fig 4. Setdb1 disruption in mouse ES cells leads to decreased enrichment of H3K9me3 at the Cdc14b transcriptional start site and increased Cdc14b expression.
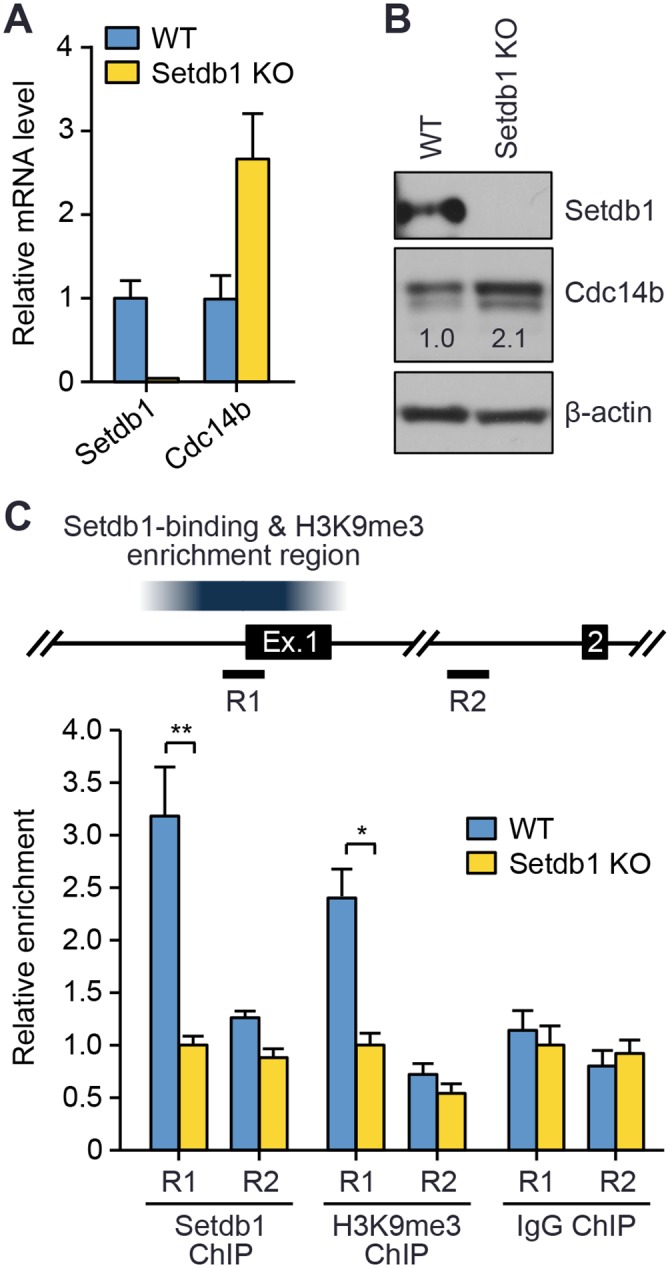
WT and Setdb12lox/1lox/CreERT2 ES cells were treated with 2 μM of 4-hydroxytamoxifen (4-OHT) for 4 days, and the cells (referred to as WT and Setdb1 KO, respectively, after 4-OHT treatment) were then used for experiments. (A) qRT-PCR analysis of Setdb1 and Cdc14b transcripts in WT and Setdb1 KO ES cells (mean ± SEM of triplicate assays). (B) Western blot analysis of Setdb1 and Cdc14b in WT and Setdb1 KO ES cells, with β-actin as a loading control. Relative band intensities were determined as described in Fig 3. (C) ChIP-qPCR analyses. Shown at the top is a portion of the Cdc14b locus, including exons 1 and 2 and the proximal promoter, which contains a major Setdb1-binding and H3K9me3 enrichment region (from ChIP-Seq data by Bilodeau et al. [30]). The regions (R1 and R2) analyzed by qPCR are indicated. The data are presented as the relative enrichment of Setdb1, H3K9me3, and control IgG at R1 and R2, with the values of Setdb1 KO samples being arbitrarily designated as 1.0.