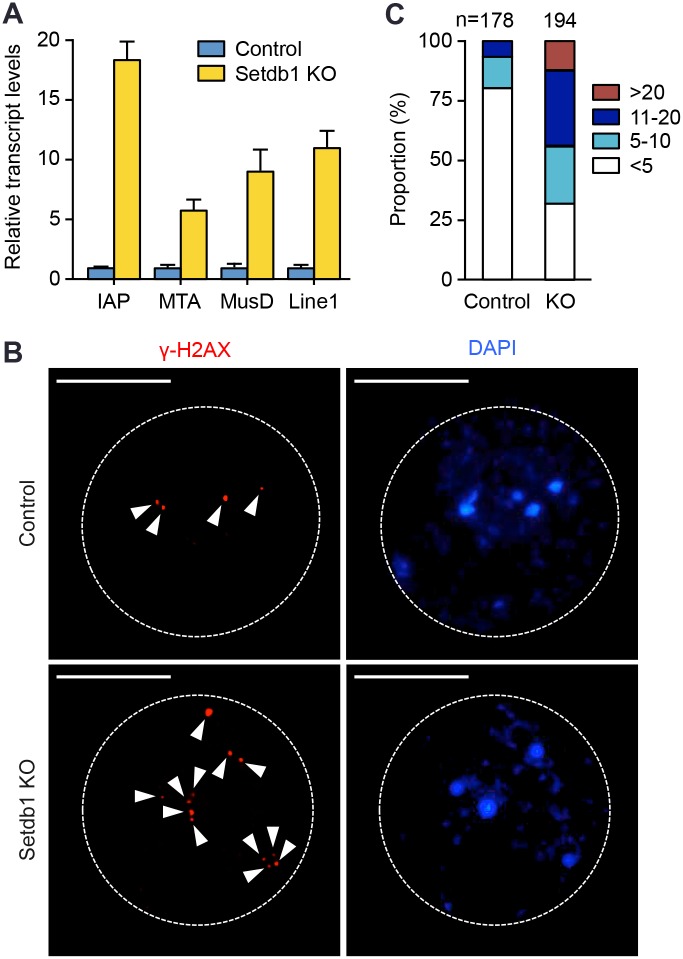
Fig 6. Setdb1 KO oocytes show derepression of retrotransposons and increased DNA double-strand breaks.
(A) qRT-PCR analysis of retrotransposon transcripts in control and Setdb1 KO GV oocytes. The data are presented as the mean ± SEM of triplicate assays. IAP, intracisternal A particles; Line1, long interspersed nuclear element 1; MTA, mouse transposon A; MusD, the type D murine LTR retrotransposon. (B, C) GV oocytes were examined for DNA double-strand breaks (DSBs) with anti-γ-H2AX staining. (B) Representative γ-H2AX (red) and DAPI (blue) images of control and Setdb1 KO oocytes. The nuclei of oocytes are circled, and the γ-H2AX foci are indicated by arrowheads. Scale bars: 10 μm. (C) The proportions of oocytes with various numbers of γ-H2AX foci in the nuclei. In total, 178 control oocytes and 194 KO oocytes were examined.

