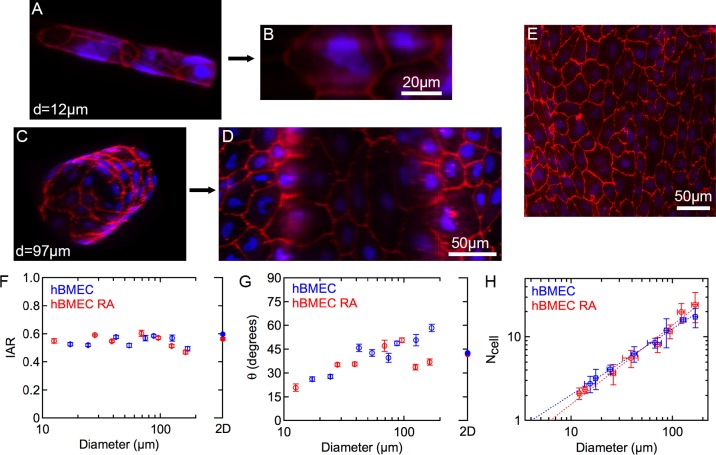
Fig 5. Influence of curvature on morphology of hBMECs.
DAPI (blue), ZO-1 (red). (A) Confocal microscopy image of hBMECs seeded on a 12 μm diameter glass rod. (B) Corresponding unwrapped 2D projection. (C) Confocal microscopy image of hBMECs seeded on a 97 μm diameter glass rod. (D) Corresponding unwrapped 2D projection. (E) Fluorescence image of a 2D monolayer of hBMECs. (F) Inverse aspect ratio of hBMECs on rods of varying diameters. (G) Average orientation angle of hBMECs versus rod diameter. (H) Number of cells wrapping around the perimeter versus rod diameter. The dotted lines show a linear least squares fit to a power law (Ncell ∝ dα) where α = 0.79 for hBMECs and α = 0.94 for hBMECs with retinoic acid. Error bars for both axes represent SE. Data was obtained from analysis of 1756 hBMEC cells and 2149 hBMEC cells cultured with retinoic acid.

