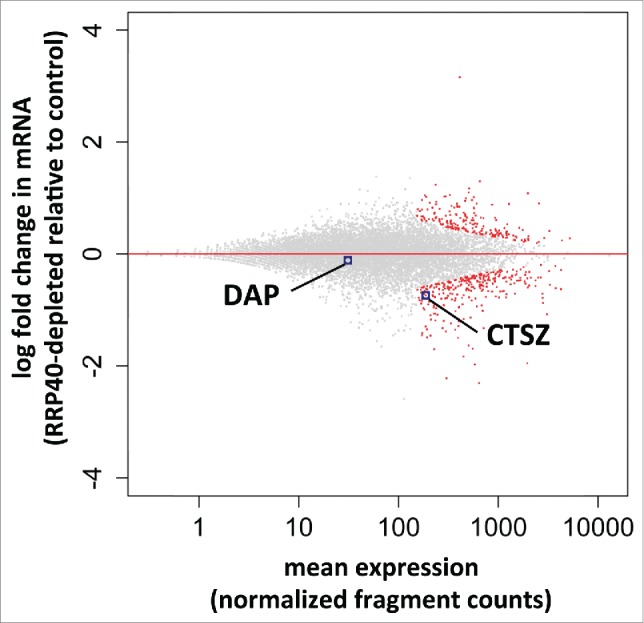
Figure 3.

Global mRNA analysis of RRP40 depleted cells. RNASeq-based expression changes of RRP40 knockdown vs. EGFP control cells. Y-axes display log2-fold changes of individual transcript levels while x-axes show the mean normalized expression (fragment counts normalized by size factors). Data were computed by the DESeq2 software.29 Individual RefSeq protein coding genes are shown in black and significantly differentially expressed genes (padj = FDR < 0.1) are colored red. Dots corresponding to DAP and CTSZ mRNAs are highlighted.
