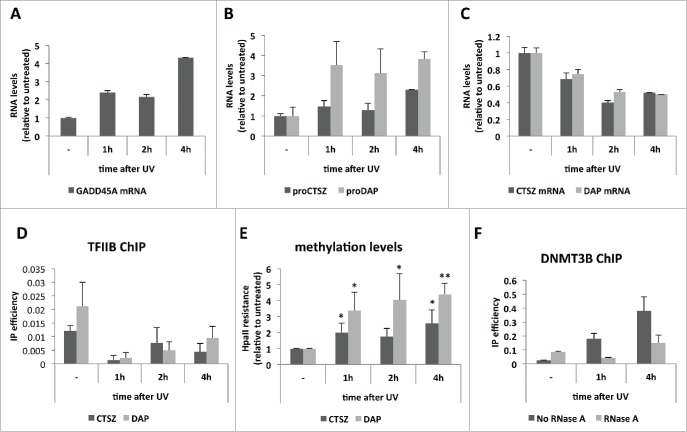
Figure 4.
PROMPT accumulation and gene transcription repression upon UV irradiation. (A) GADD45A mRNA levels as measured by RT-qPCR along the indicated time course after UV irradiation of HeLa cells. (B) CTSZ (dark gray) and DAP (light gray) PROMPT levels measured and plotted as in (A). (C) CTSZ (dark gray) and DAP (light gray) mRNA levels measured and plotted as in (B). For A), B) and C) a representative experiment is shown out of 3 independent biological replicates. Graphs show RNA levels relative to the untreated sample. Error bars show standard deviations from 3 technical replicates. (D) TFIIB IP efficiencies along the UV time course from (A) as measured by ChIP-qPCR of the CTSZ (dark gray) and DAP (light gray) promoter regions. Error bars show standard deviations from 3 technical replicates of a representative experiment of 3 biological replicates. (E) Methylation levels at the CTSZ (dark gray) and DAP (light gray) promoter regions as measured by HpaII resistance along the UV time course from (A). Values were plotted relative to levels of the untreated sample. Error bars show standard deviations from 3 biological replicates. P-values were calculated with an unpaired 2-tailed Student's t-test comparing each time point to the corresponding untreated sample. (*) P-value < 0.05; (**) P-value < 0.01. (F) DNMT3B ChIP efficiencies measured by the ‘-1026’ amplicon from Figure 2D along the indicated UV time course. IP efficiences of samples treated (light gray) or not (dark gray) with RNase A before the IP are shown. Error bars show standard deviations from 3 technical replicates of a representative experiment.

