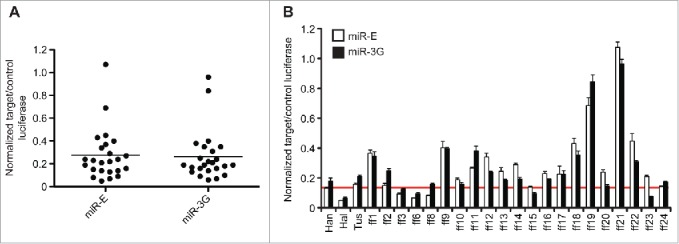
Figure 3.

Expanded and sensitized comparison of miR-3G vs. miR-E-based knockdown. (A) 24 unique firefly luciferase targeting sequences were expressed from either the miR-E or miR-3G hairpin contexts. All amiRNA plasmids were co-transfected into HEK293T cells in a 1:60 ratio with the target (ff-luc) expression vector, and knockdown was evaluated relative to control (Rr-luc) ∼40 hours post-transfection. Each point represents and average of 4 technical triplicates, derived from a representative experiment, and bars represent the mean for individual data sets. (B) All conditions described in (A) shown as pairwise comparisons between each individual targeting sequence delivered via miR-3G (black bars) or miR-E (white bars). Shown is a representative experiment (N=2 ) performed in technical quadruplicate. Error bars represent one standard deviation of uncertainty, based on the sampled quadruplicates. A red bar marks the efficiency of the Han targeting sequence in the miR-E format.
