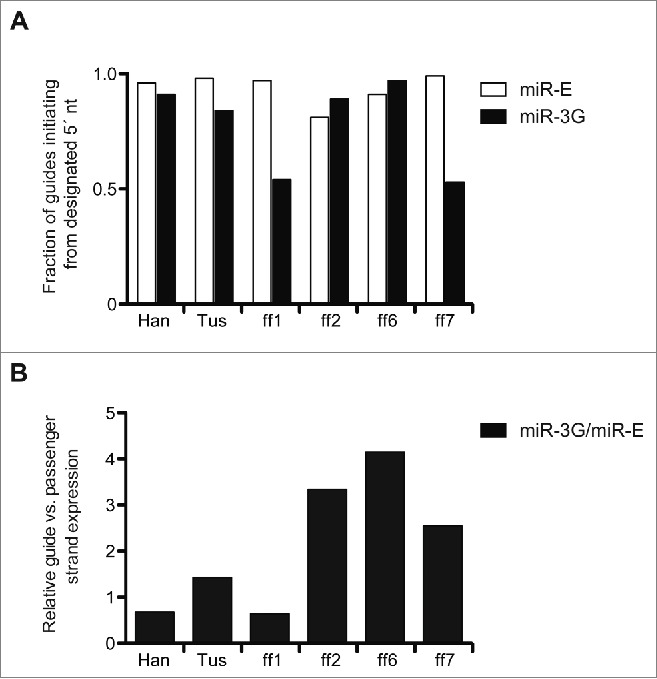
Figure 5.

Potential liabilities identified for miR-3G and miR-E-based RNAi. (A) Total guide RNA values were determined by adding all reads with the designated guide RNA 5′ nt, as well as those +/− 1 nt 5′ shifted from the appropriate start site. Displayed are the ratios, for each targeting sequence and hairpin context, of guides with the appropriate 5′ nt relative to the total guide RNA read count. (B) Total guide RNA read counts (computed as in A) and passenger strand reads, which included the dominant passenger strand read and all reads with a +/− 1 nt 5′ shift are compared for miR-3G relative to miR-E.
