
Figure 6.
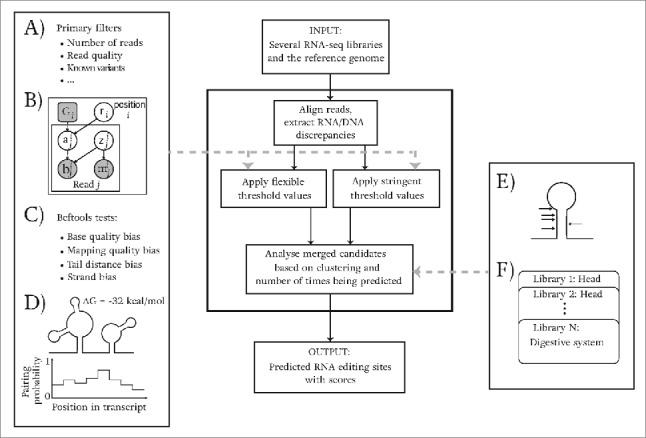
Outline of the computational analysis pipeline for identifying editing events from multiple RNA-seq libraries. The input consists of several RNA-seq libraries and the reference genome. As shown, first, reads are aligned and RNA/DNA mismatches are extracted. Then, 2 sets of values (for flexible and stringent filtering) are used for several filters ((A) - (D)) to remove potential experimental artifacts. Finally, our pipeline considers clustering of identified candidates and the number of times they are detected in multiple libraries to output a final set of predicted editing events. (A) - (D) show the statistical tests and filters used in our pipeline. (A) A set of primary filters used to assess the initial requirements for candidate sites. (B) The statistical graphical model (modified from62) that we use to find the maximum editing ratio, and to compute a log likelihood ratio score. Shaded circles are the random variables that are observed in data and unshaded circles are the ones that are inferred. The rounded square is fixed to represent the reference genotype. is a binary variable which indicates whether or not a read aligned to a position comes from an edited molecule. z is also a binary variable that indicates whether the read is aligned correctly. The editing ratio of position i is presented with node r; and nodes m and b present mapping and base qualities. (C) Statistical tests in samtools/bcftools63 to check the potential biases in reads. (D) The energy of local structures and base pairing probabilities of nucleotides in close vicinity of candidate sites are used to ensure the structural requirements of candidates are met. (E) We use the fact that editing events occur in clusters to improve our predictions. (F) For less confident sites, the site requires to be detected in multiple libraries in order to be reported in our final set.