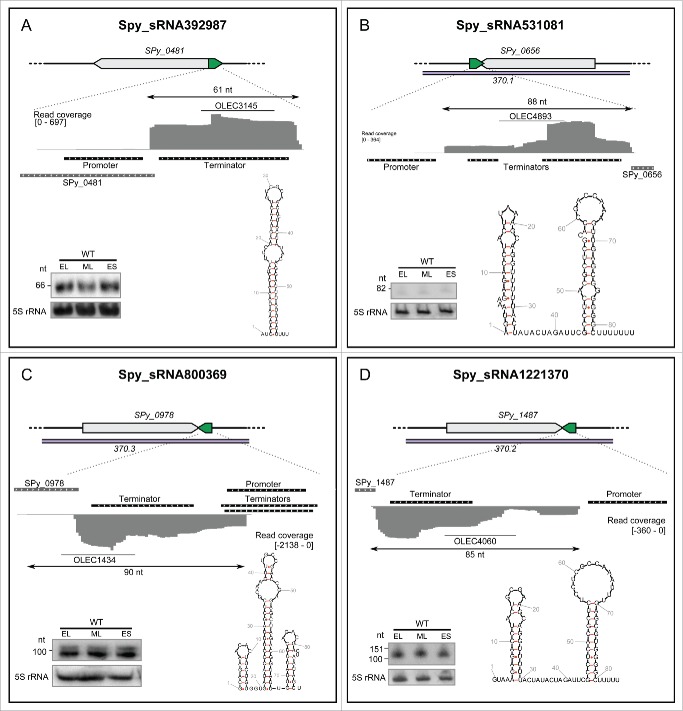
Figure 4.
Expression profiles of selected asRNAs. For each asRNA, the locus is depicted with the asRNA in green and the antisense genes in gray. The prophage regions are indicated in purple. The RNA sequencing expression profiles are captured using the Integrative Genomics Viewer (IGV) software. The sequence coverage was calculated using BEDTools-Version-2.15.0 and the scale is given in number of reads per million. The putative promoters and terminators are indicated in black. Northern blot analysis (polyacrylamide gel electrophoresis) was performed in WT (SF370) strains grown to early logarithmic (EL), mid logarithmic (ML) and early stationary (ES) phases. The position of the oligonucleotide probes (OLEC) used in Northern blot analysis is indicated below the sequence coverage. The 5S rRNA is used as a loading control. Folding for the sRNAs was predicted using RNAfold (rna.tbi.univie.ac.at/cgi-bin/RNAfold.cgi). See also Figures S6, S7 and S8 for additional information regarding sRNAs.

