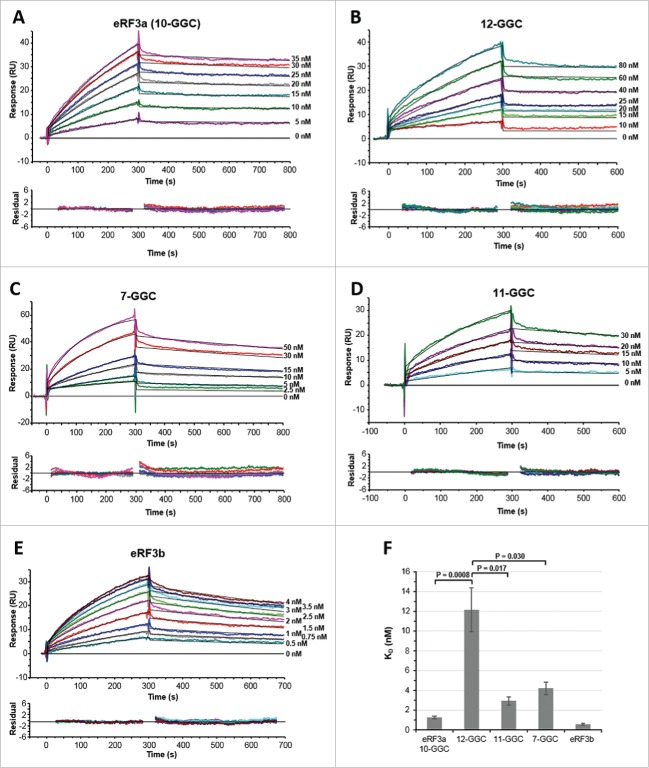
Figure 1.
SPR analysis of the interaction between eRF3 and PABP (2000–2200 RU) immobilized on a CM5 sensor chip surface. Typical experimental sensorgrams (top panels) and residual plots (difference between calculated and experimental data points, bottom panels) are shown for eRF3a 10-GGC allele (A), eRF3a 12-GGC allele (B), eRF3a 7-GGC allele (C), eRF3a 11-GGC allele (D), and eRF3b (E). The different concentrations of the injected analytes are indicated on the right of the sensorgrams (for experimental details see Materials and Methods). Data were treated and integrated using a simple Langmuir 1:1 model. For each analyte concentration the fitted curve is shown in black. (F) Comparison of eRF3a alleles and eRF3b equilibrium dissociation constants (KD) listed in Table 1. Error bars indicate the standard error (SEM). Statistical significance (P-values from unpaired Student's t-test) of differences between eRF3a 12-GGC and other eRF3a alleles are indicated.

