
Figure 2.
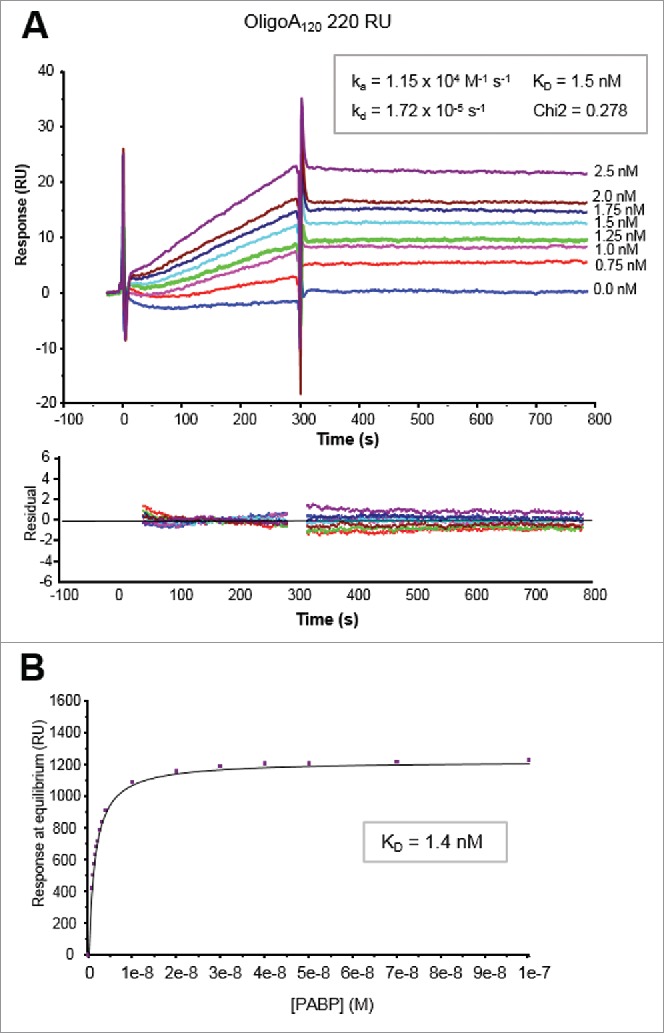
Kinetic analyses of PABP binding to 5′ biotinylated OligoA120 RNA (220 RU) immobilized onto a SA sensor chip surface. (A) Sensorgrams of the binding profiles using a Langmuir 1:1 binding model (top panel) and residuals plots (bottom panel) are shown. Concentrations of PABP injected are indicated on the right of the sensorgrams. Kinetic parameters (ka, kd and KD) and the Chi2 value of the fitting are also indicated. (B) Plot of the response vs. PABP concentration used for the steady-state affinity fitting with the BIAevaluation software (see text for details).